🟣 1. Impulses vs. Corrections – The Classical View
When price trends, it doesn't move in a straight line. Instead, it alternates between directional movements called impulses and counter-directional pauses or retracements known as corrections. Most analysts define an impulse as a sharp, dominant move in the direction of the trend—typically accompanied by rising volume and momentum indicators. Corrections, on the other hand, tend to be slower, overlapping, and often occur with declining volume.
Common methods to identify impulses vs. corrections include:
Despite the abundance of methods, the distinction between impulses and corrections often remains subjective. That’s where the Directional Movement Index (DMI) provides an objective lens—especially when paired with price action.
🟣 2. Rethinking Impulses with the DMI Indicator
The Directional Movement Index (DMI), developed by J. Welles Wilder, offers a quantitative way to assess the strength and direction of price movement. It breaks down market activity into three components:
The key to applying DMI lies in the crossover between +DMI and -DMI:
Calculation is based on a comparison of successive highs and lows over a specific lookback period—commonly set to 14 or 20 periods.
While EMAs track trend direction and momentum, DMI helps dissect who’s in control. This makes it a powerful filter when evaluating whether a breakdown or breakout is likely to become an impulsive trend—or just another correction in disguise.
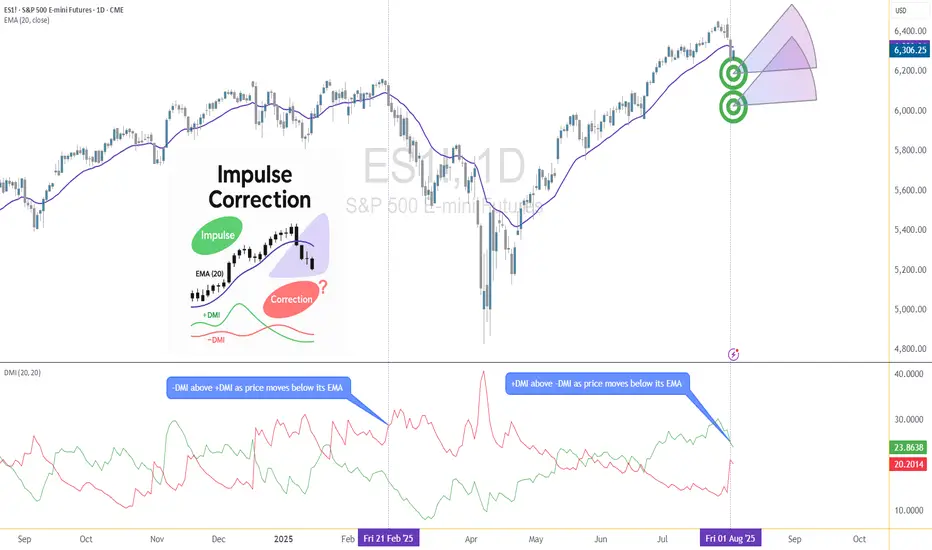
🟣 3. Case Study – Two Breakdowns, Two Outcomes
Let’s apply this logic to two recent moments on the E-mini S&P 500 Futures (ES) daily chart.
🔹 Feb 21, 2025 Breakdown
Price broke sharply below the 20-period EMA. At first glance, this looked like a potential trend reversal. The DMI confirmed this suspicion: −DMI surged above +DMI, signaling downside impulses were in control. The market followed through with a clear downtrend, confirming the move was not just a pullback—it was a shift in market structure.
🔹 Aug 1, 2025 Breakdown
A similar sharp break below the 20 EMA just occurred again. However, this time +DMI remains above −DMI, despite the bearish price action. This divergence tells a different story: the breakdown may not be impulsive in nature. Instead, it's likely a corrective dip within a broader uptrend, where buyers are still the dominant force.
This is a textbook example of how a moving average crossover without DMI confirmation can mislead traders. By combining these tools, we’re able to make more informed decisions about whether price action is signaling a true shift—or just a pause.
🟣 4. CME Product Specs – ES vs. MES
Traders can express directional views on the S&P 500 using two primary CME futures contracts: the E-mini S&P 500 Futures (ES) and the Micro E-mini S&P 500 Futures (MES). Both track the same underlying index but differ in size, capital requirement, and tick value.
✅ E-mini S&P 500 Futures (ES)
✅ Micro E-mini S&P 500 Futures (MES)
The Micro contract provides access to the same market structure, liquidity, and price movement as the E-mini, but with a fraction of the exposure—making it ideal for smaller accounts or more precise position sizing.
🟣 5. Risk Management Matters
Understanding whether a market move is impulsive or corrective isn’t just academic—it’s the difference between positioning with the dominant flow or fighting it. Traders often get trapped by sharp moves that appear trend-defining but are simply noise or temporary pullbacks.
Using tools like DMI to confirm whether directional strength supports price action provides a layer of risk filtration. It prevents overreaction to every EMA crossover or sudden price drop.
Stop-loss orders become vital in both impulsive and corrective conditions. In impulsive environments, stops help lock in profits while protecting from reversals. In corrective phases, they act as circuit breakers against breakouts that fail.
Moreover, knowing the product you're trading is critical:
This disparity means poor sizing on ES can magnify errors, while proper sizing on MES can offer flexibility to test, scale, and hedge with tighter capital control.
Whether you're reacting to price or preparing for continuation, risk management is the only constant. It’s what turns analysis into disciplined execution.
When charting futures, the data provided could be delayed. Traders working with the ticker symbols discussed in this idea may prefer to use CME Group real-time data plan on TradingView: tradingview.com/cme/ - This consideration is particularly important for shorter-term traders, whereas it may be less critical for those focused on longer-term trading strategies.
General Disclaimer:
The trade ideas presented herein are solely for illustrative purposes forming a part of a case study intended to demonstrate key principles in risk management within the context of the specific market scenarios discussed. These ideas are not to be interpreted as investment recommendations or financial advice. They do not endorse or promote any specific trading strategies, financial products, or services. The information provided is based on data believed to be reliable; however, its accuracy or completeness cannot be guaranteed. Trading in financial markets involves risks, including the potential loss of principal. Each individual should conduct their own research and consult with professional financial advisors before making any investment decisions. The author or publisher of this content bears no responsibility for any actions taken based on the information provided or for any resultant financial or other losses.
When price trends, it doesn't move in a straight line. Instead, it alternates between directional movements called impulses and counter-directional pauses or retracements known as corrections. Most analysts define an impulse as a sharp, dominant move in the direction of the trend—typically accompanied by rising volume and momentum indicators. Corrections, on the other hand, tend to be slower, overlapping, and often occur with declining volume.
Common methods to identify impulses vs. corrections include:
- Swing structure: Higher highs and higher lows suggest impulse; overlapping lows suggest correction.
- Fibonacci retracements: Corrections often retrace up to 61.8% of a prior impulse.
- Moving averages: Price above a rising MA is often viewed as impulse territory.
- Volume analysis and oscillators such as RSI or MACD are used to confirm price behavior.
Despite the abundance of methods, the distinction between impulses and corrections often remains subjective. That’s where the Directional Movement Index (DMI) provides an objective lens—especially when paired with price action.
🟣 2. Rethinking Impulses with the DMI Indicator
The Directional Movement Index (DMI), developed by J. Welles Wilder, offers a quantitative way to assess the strength and direction of price movement. It breaks down market activity into three components:
- +DMI (Positive Directional Movement Index): Measures the strength of upward movements.
- −DMI (Negative Directional Movement Index): Measures the strength of downward movements.
- ADX (Average Directional Index): Quantifies overall trend strength but is optional in this discussion.
The key to applying DMI lies in the crossover between +DMI and -DMI:
- When +DMI > -DMI, upward price moves dominate—suggesting bullish impulses.
- When −DMI > +DMI, downward moves dominate—suggesting bearish impulses.
Calculation is based on a comparison of successive highs and lows over a specific lookback period—commonly set to 14 or 20 periods.
While EMAs track trend direction and momentum, DMI helps dissect who’s in control. This makes it a powerful filter when evaluating whether a breakdown or breakout is likely to become an impulsive trend—or just another correction in disguise.
🟣 3. Case Study – Two Breakdowns, Two Outcomes
Let’s apply this logic to two recent moments on the E-mini S&P 500 Futures (ES) daily chart.
🔹 Feb 21, 2025 Breakdown
Price broke sharply below the 20-period EMA. At first glance, this looked like a potential trend reversal. The DMI confirmed this suspicion: −DMI surged above +DMI, signaling downside impulses were in control. The market followed through with a clear downtrend, confirming the move was not just a pullback—it was a shift in market structure.
🔹 Aug 1, 2025 Breakdown
A similar sharp break below the 20 EMA just occurred again. However, this time +DMI remains above −DMI, despite the bearish price action. This divergence tells a different story: the breakdown may not be impulsive in nature. Instead, it's likely a corrective dip within a broader uptrend, where buyers are still the dominant force.
This is a textbook example of how a moving average crossover without DMI confirmation can mislead traders. By combining these tools, we’re able to make more informed decisions about whether price action is signaling a true shift—or just a pause.
🟣 4. CME Product Specs – ES vs. MES
Traders can express directional views on the S&P 500 using two primary CME futures contracts: the E-mini S&P 500 Futures (ES) and the Micro E-mini S&P 500 Futures (MES). Both track the same underlying index but differ in size, capital requirement, and tick value.
✅ E-mini S&P 500 Futures (ES)
- Symbol: ES
- Contract Size: $50 x S&P 500 Index
- Tick Size: 0.25 index points
- Tick Value: $12.50
- Initial Margin: Approximately $21,000 (varies by broker and through time)
- Market Hours: Nearly 24/6
✅ Micro E-mini S&P 500 Futures (MES)
- Symbol: MES
- Contract Size: $5 x S&P 500 Index
- Tick Size: 0.25 index points
- Tick Value: $1.25
- Initial Margin: Approximately $2,100 (varies by broker and through time)
The Micro contract provides access to the same market structure, liquidity, and price movement as the E-mini, but with a fraction of the exposure—making it ideal for smaller accounts or more precise position sizing.
🟣 5. Risk Management Matters
Understanding whether a market move is impulsive or corrective isn’t just academic—it’s the difference between positioning with the dominant flow or fighting it. Traders often get trapped by sharp moves that appear trend-defining but are simply noise or temporary pullbacks.
Using tools like DMI to confirm whether directional strength supports price action provides a layer of risk filtration. It prevents overreaction to every EMA crossover or sudden price drop.
Stop-loss orders become vital in both impulsive and corrective conditions. In impulsive environments, stops help lock in profits while protecting from reversals. In corrective phases, they act as circuit breakers against breakouts that fail.
Moreover, knowing the product you're trading is critical:
- A single ES contract controls ~$320,000 of notional value.
- An MES contract controls ~$32,000.
This disparity means poor sizing on ES can magnify errors, while proper sizing on MES can offer flexibility to test, scale, and hedge with tighter capital control.
Whether you're reacting to price or preparing for continuation, risk management is the only constant. It’s what turns analysis into disciplined execution.
When charting futures, the data provided could be delayed. Traders working with the ticker symbols discussed in this idea may prefer to use CME Group real-time data plan on TradingView: tradingview.com/cme/ - This consideration is particularly important for shorter-term traders, whereas it may be less critical for those focused on longer-term trading strategies.
General Disclaimer:
The trade ideas presented herein are solely for illustrative purposes forming a part of a case study intended to demonstrate key principles in risk management within the context of the specific market scenarios discussed. These ideas are not to be interpreted as investment recommendations or financial advice. They do not endorse or promote any specific trading strategies, financial products, or services. The information provided is based on data believed to be reliable; however, its accuracy or completeness cannot be guaranteed. Trading in financial markets involves risks, including the potential loss of principal. Each individual should conduct their own research and consult with professional financial advisors before making any investment decisions. The author or publisher of this content bears no responsibility for any actions taken based on the information provided or for any resultant financial or other losses.
🌟 Take This Analysis Further with Our AI Scripts 🎯 | Discover How at tradewithufos.com 🚀 Choose a Subscription: Monthly ᴼᴿ Yearly ᴼᴿ Lifetime 🗓️ | Unlock Intelligent UFO Scripts Free 💡
Related publications
Disclaimer
The information and publications are not meant to be, and do not constitute, financial, investment, trading, or other types of advice or recommendations supplied or endorsed by TradingView. Read more in the Terms of Use.