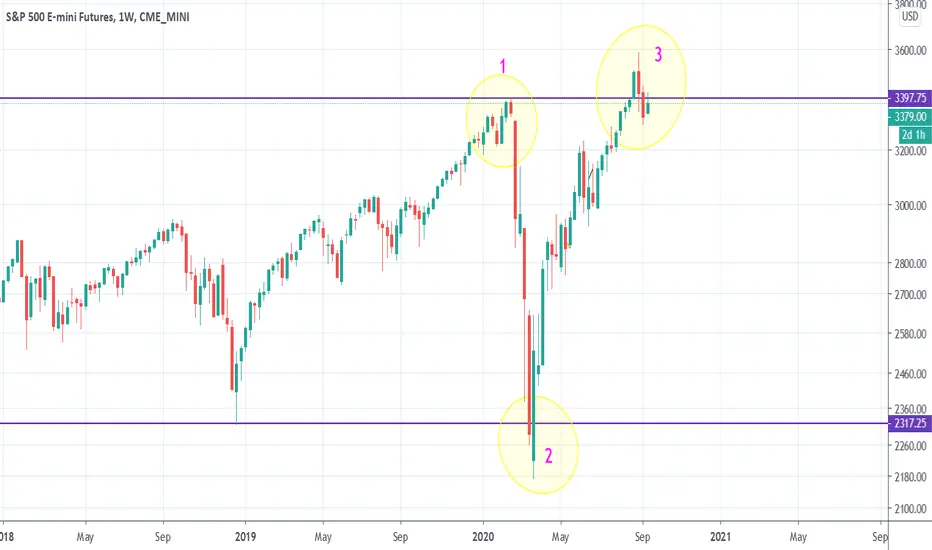
This is not a typical chart I post but something I'll keep an eye on for future development and my own curiosity. The main thing I want to note is the over shoot on figure 2 looks very similar to the overshoot on figure 3. If you noticed both are overshoots of previous lows/highs. The two horizontal blue lines represent the previous low and high.
Note
Very clear we need above 3400-3425 before I can be full on bull bias. Stimulus needs to be passed.Note
As long price holds outside the purple range price will gravitate upward.Disclaimer
The information and publications are not meant to be, and do not constitute, financial, investment, trading, or other types of advice or recommendations supplied or endorsed by TradingView. Read more in the Terms of Use.
Disclaimer
The information and publications are not meant to be, and do not constitute, financial, investment, trading, or other types of advice or recommendations supplied or endorsed by TradingView. Read more in the Terms of Use.