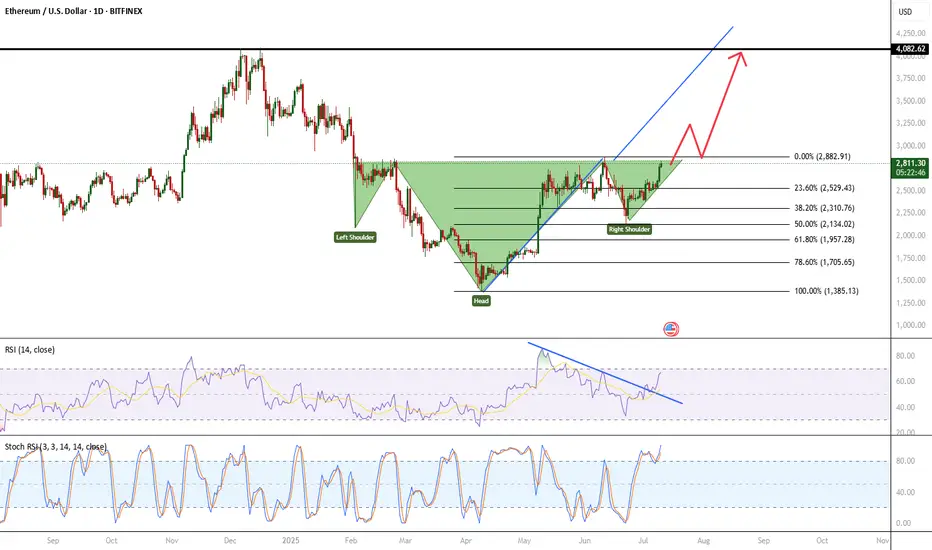
Ethereum is currently forming a textbook Inverse Head and Shoulders pattern on the chart.
✅ Left Shoulder: Formed after initial sell-off
✅ Head: Deep low, marking the bottom
✅ Right Shoulder: Higher low, indicating waning selling pressure
✅ Neckline: Being tested now
🔹 Fib Retracement: Price corrected exactly to the 50% Fibonacci level, a key support zone.
📈 Indicators:
RSI trending above 50
MACD showing bullish momentum
Volume increasing on up moves
💥 Breakout Target: $4,000 (based on measured move from the head to neckline)
🛑 Invalidation: Break below right shoulder structure
This setup looks promising, but confirmation is key. Watching for a strong breakout and close above the neckline with volume before entering.
Let me know your thoughts or setups in the comments!
#Ethereum #ETHUSD #CryptoTrading #ChartPatterns #TechnicalAnalysis #InverseHeadAndShoulders #Fibonacci #BreakoutWatch
Disclaimer
The information and publications are not meant to be, and do not constitute, financial, investment, trading, or other types of advice or recommendations supplied or endorsed by TradingView. Read more in the Terms of Use.
Disclaimer
The information and publications are not meant to be, and do not constitute, financial, investment, trading, or other types of advice or recommendations supplied or endorsed by TradingView. Read more in the Terms of Use.