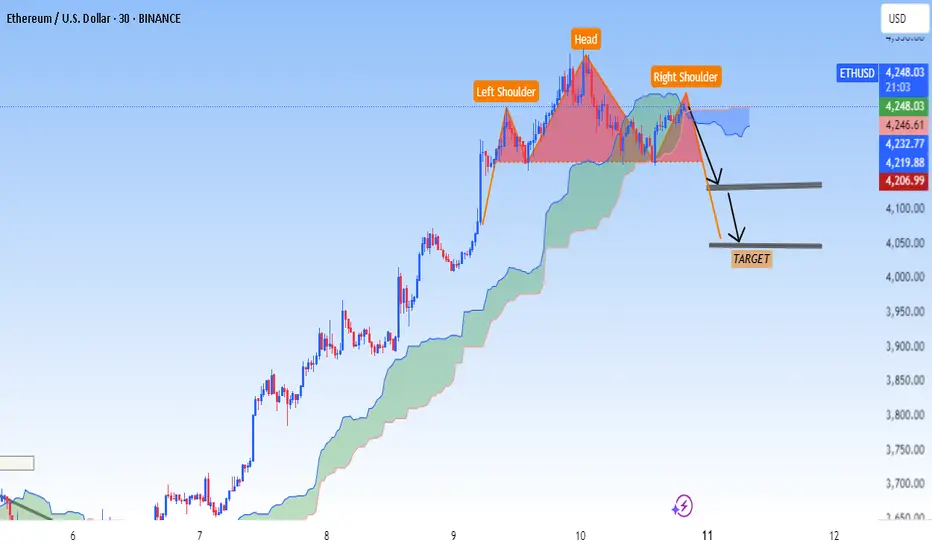
This ETH/USD 30-minute chart is showing a Head and Shoulders pattern.
Analysis:
Left Shoulder: Formed after a price peak and pullback.
Head: Higher peak at around 4,425–4,430.
Right Shoulder: Lower peak, failing to break above the head’s high.
Neckline: Around the 4,220–4,225 zone.
Target:
The measured move is taken from the head’s peak to the neckline (~200 points).
If price breaks below the neckline at ~4,220, the projected target is around 4,050 (as marked in your chart).
Summary:
Pattern: Head and Shoulders
Breakout Direction: Bearish
Target: ~4,050
✅JOIN FREE TELEGRAM
✅t.me/+atTT3a4htZ8yZjQ0
✅DAILY 3-4 SIGNALS
✅ALL PAIRS CRYPTO & GOLD
✅t.me/+atTT3a4htZ8yZjQ0
✅DAILY 3-4 SIGNALS
✅ALL PAIRS CRYPTO & GOLD
Disclaimer
The information and publications are not meant to be, and do not constitute, financial, investment, trading, or other types of advice or recommendations supplied or endorsed by TradingView. Read more in the Terms of Use.