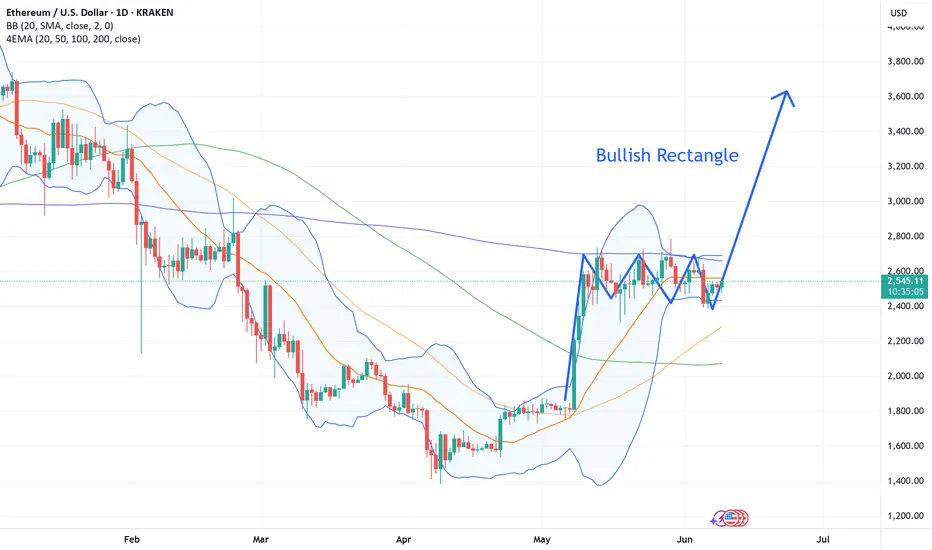
Bullish Rectangle. The potential price target following a breakout from a bullish rectangle is typically estimated by measuring the height of the rectangle and adding it to the breakout point. This provides a rough projection of how far the price might rally.
A bullish rectangle is a chart pattern characterized by price consolidating between two parallel horizontal lines, forming a distinct rectangular shape. The upper line acts as resistance, a level where selling pressure has historically halted price advances. The lower line represents support, where buying interest has consistently emerged to prevent further declines. This period of sideways trading signifies a temporary pause in the prevailing uptrend, as buyers and sellers reach a temporary equilibrium.
A bullish rectangle is a chart pattern characterized by price consolidating between two parallel horizontal lines, forming a distinct rectangular shape. The upper line acts as resistance, a level where selling pressure has historically halted price advances. The lower line represents support, where buying interest has consistently emerged to prevent further declines. This period of sideways trading signifies a temporary pause in the prevailing uptrend, as buyers and sellers reach a temporary equilibrium.
Disclaimer
The information and publications are not meant to be, and do not constitute, financial, investment, trading, or other types of advice or recommendations supplied or endorsed by TradingView. Read more in the Terms of Use.
Disclaimer
The information and publications are not meant to be, and do not constitute, financial, investment, trading, or other types of advice or recommendations supplied or endorsed by TradingView. Read more in the Terms of Use.