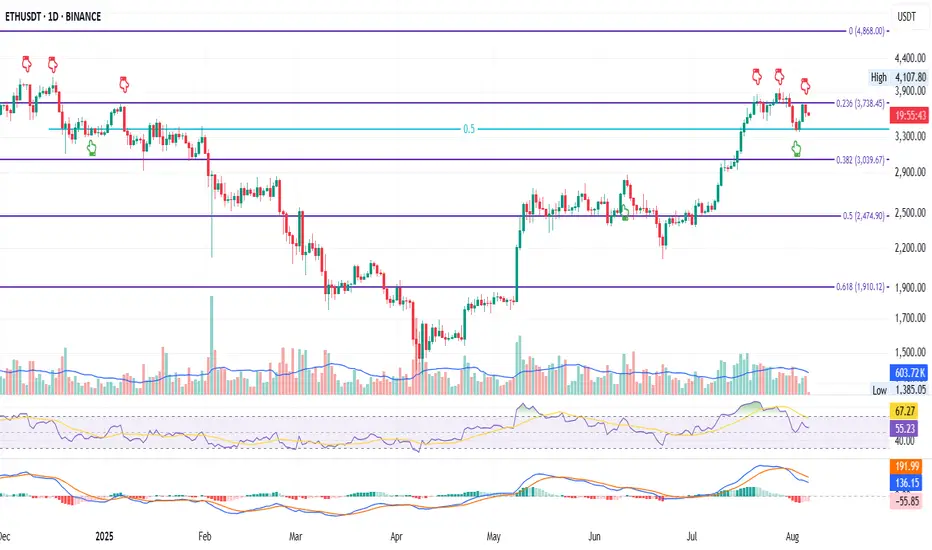
This is ETH on the Daily
Price action today looks very similar to December 2024.
Back then, ETH attempted twice to flip the 0.236 Fib level at $3378.45 — first on Dec 6, then on Dec 12. Both failed. Price found support at the 0.5 (midpoint between the 0.236 and 0.382), bounced, got rejected again at the 0.236, then went lower.
Now, we’re seeing a near-identical pattern:
– First attempt to reclaim the 0.236 Fib on July 21
– Second attempt on July 27
– Both failed
– Price found support again at the 0.5 middle level
– Bounced back to the 0.236
– Got rejected again
What will happen this time?
For me, the answer already came: we’ve now seen a lower low followed by a lower high — a temporary break of bullish structure. That’s my cue to scale out of my long and reduce exposure so I’m not caught off guard overnight.
Now that I’ve done that, I can observe the chart objectively without emotional bias or panic-selling.
Technically, ETH is in a short-term downtrend.
Fundamentally, however, I believe we’re in the early stages of a larger uptrend, driven by strong bullish news around crypto (happy to list them if you're curious).
But until those bullish narratives start kicking in and price moves up again, I have to be extremely careful not to get wiped out — so I’ll stay closely aligned with price action.
Like I said: short-term downtrend, long-term opportunity.
Always take profits and manage risk.
Interaction is welcome.
Trade closed manually
Bear structure broken — Disclaimer
The information and publications are not meant to be, and do not constitute, financial, investment, trading, or other types of advice or recommendations supplied or endorsed by TradingView. Read more in the Terms of Use.
Disclaimer
The information and publications are not meant to be, and do not constitute, financial, investment, trading, or other types of advice or recommendations supplied or endorsed by TradingView. Read more in the Terms of Use.