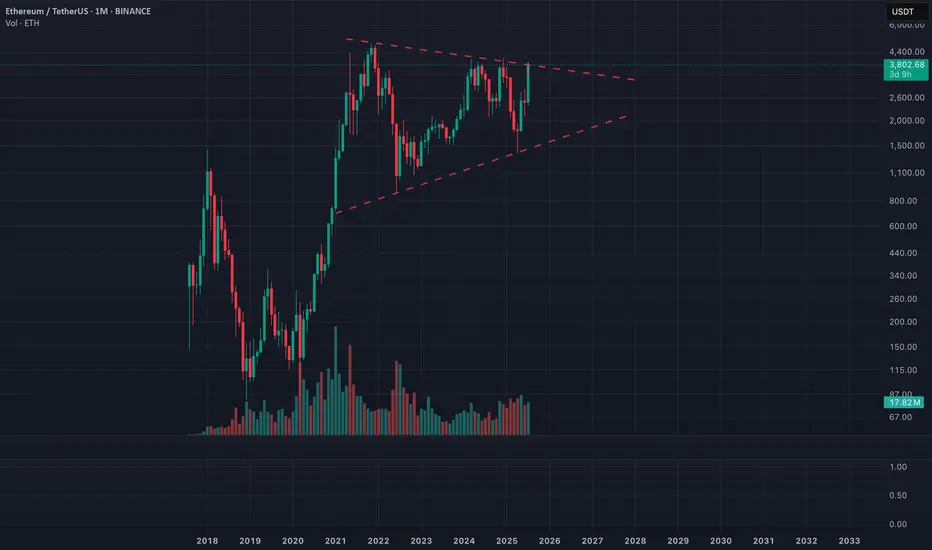
ETH has formed a massive symmetrical triangle since the 2021 top (~$4,800).
This triangle has been tightening since 2022 with:
- Lower highs from $4,800 → ~$4,000
- Higher lows from ~$850 → $1,370 → $1,850+
We now close to the apex, meaning a major breakout or breakdown is imminent in the coming weeks/months.
Price Action
ETH is pressing against the upper resistance of the triangle (~$3,850–3,950).
A monthly close above $4,000 would be the first breakout in over 2 years.
Volume
Volume has decreased over time, typical for a symmetrical triangle.
We are looking for volume increase on breakout to confirm it’s on the right track.
Momentum (Laguerre RSI: 0.67)
Momentum is rising, supportive of a bullish breakout.
RSI is not yet overbought, so there’s room for continuation.
Scenarios
Bullish Breakout Scenario:
Trigger: Monthly close above $4,000–4,200
Target: ~$7,000–7,500
Timeline: Could play out over 3–6 months
Bearish Breakdown Scenario
Trigger: Monthly close below $2,500
Target Zone: $1,850 → $1,300 (last major supports)
Would invalidate the higher low structure
I am bullish but it is hard to not to be cautious given its crypto and this is a pretty tough resistance.
Do your own research and make responsible decisions all.
Peace out.
Disclaimer
The information and publications are not meant to be, and do not constitute, financial, investment, trading, or other types of advice or recommendations supplied or endorsed by TradingView. Read more in the Terms of Use.
Disclaimer
The information and publications are not meant to be, and do not constitute, financial, investment, trading, or other types of advice or recommendations supplied or endorsed by TradingView. Read more in the Terms of Use.