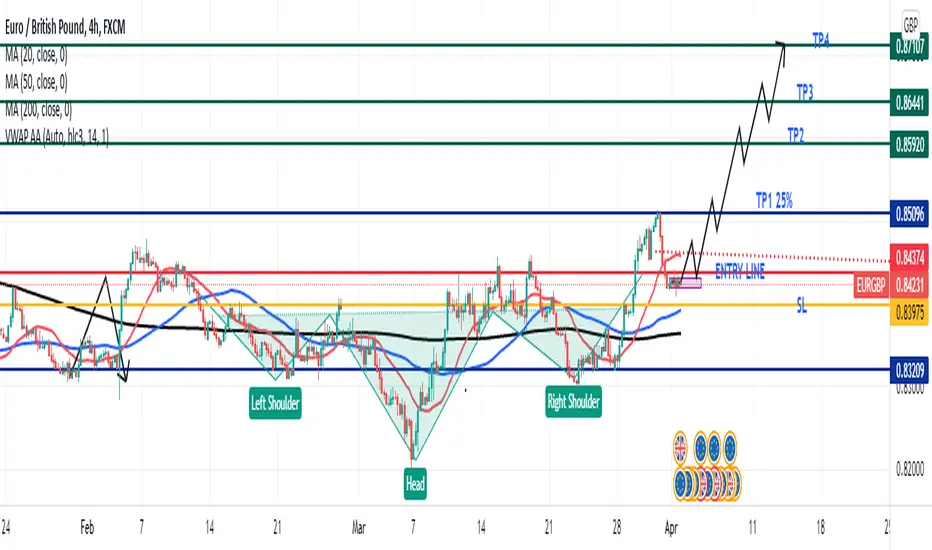
Pair in long term downtrend. But on my chart I can see inverse head and shoulders pattern. It looks, price formed this pattern, then break the neckline and now retested the broken resistance (neckline). So it is likely, that pair going to reverse and bullish scenario is possible. There are two issues with this idea. Upper blue line is last week high. Because EURGBP is reversal pair, last week high is very strong resistance. Bottomed red line is the 200MA on daily chart. A super strong resistance. So why should you go long? Because the HH pattern and also price consolidation is just under the resistance, which means, bulls are ready to push the price higher. Also if price breaks the 200MA on daily it is a change of trend. If I´m wrong, price will be rejected down from last week high or 200MA on 1D chart. This is about to understand the process.
Plan
Enter when any of 1H candles closes above the entry line. Then monitor your trade till it crosses the bottomed red line (200MA 1D). If any of 8H candles closes above bottomed line, you are safe. SL is calculated as 1 ATR from 4H chart (alternatively you can use 1,5= 160 points). It is likely that price will retest again the entry line, but if not it will fly higher and we wont have more chance to enter safely. To be safe you can set your SL to BE when price will approaching to bottomed red line. I´m always updating my ideas during validity. So if - when entry conditions are met and you follow me, you going to get the message(exept I´m sleeping during Asia) . Don´t set buy stop. Why? Because it can trigger but price won´t stay above the entry line. 1H candle HAVE TO close. TP your position partially. TP lines are also very strong pullback areas. Never let your flooting profit to disappear. Or worse, turn to loose. I´m not a signal service. I´m trading my own ideas for living. If you want to trade with me, I´ll do my best to help you make some money. Check my previous ideas if you are interested. Wish you good luck.
Do not have 30K followers, do not have to share 15 trade a day, because you pay subscription, do not live from subscription, but sharing my knowledge trades and signals. For free. If you want to join, you are welcomed. t.me/+CE3Vdc5m72w4MjRk
Disclaimer
The information and publications are not meant to be, and do not constitute, financial, investment, trading, or other types of advice or recommendations supplied or endorsed by TradingView. Read more in the Terms of Use.