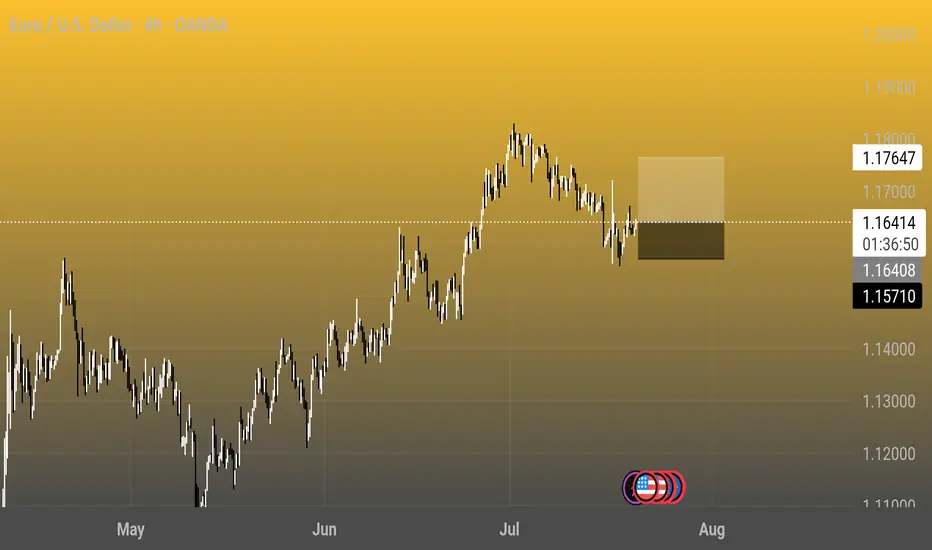
4-hour candlestick chart showing the exchange rate between the Euro (EUR) and the U.S. Dollar (USD) from May to August 2025. The current rate is 1.16416, with a 0.14% increase (+0.00161). The chart highlights a peak around late June to early July, followed by a decline, with notable support and resistance levels marked at 1.17647 and 1.16416, respectively.
Trade closed: target reached
Perfect target achieved Daily XAU/USD FREE setups | Let's grow together!
| XAU/USD Trader | Telegram: https://t.me/Aleegoldsignals
| XAU/USD Trader | Telegram: https://t.me/Aleegoldsignals
Disclaimer
The information and publications are not meant to be, and do not constitute, financial, investment, trading, or other types of advice or recommendations supplied or endorsed by TradingView. Read more in the Terms of Use.
Daily XAU/USD FREE setups | Let's grow together!
| XAU/USD Trader | Telegram: https://t.me/Aleegoldsignals
| XAU/USD Trader | Telegram: https://t.me/Aleegoldsignals
Disclaimer
The information and publications are not meant to be, and do not constitute, financial, investment, trading, or other types of advice or recommendations supplied or endorsed by TradingView. Read more in the Terms of Use.