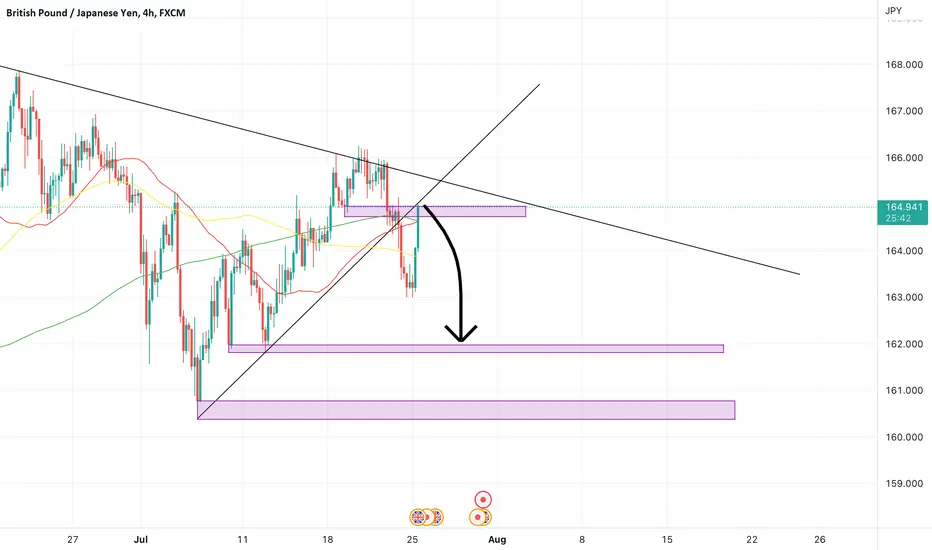
From what I can see, there seems to be a possible break & retest pattern on the 4H timeframe. This is after price respected the downwards trend line. If price does revisits the support area of 160.500, there’s a possibility of price being bullish because on the daily timeframe, the pattern that I can see would resemble an ascending triangle.
Disclaimer
The information and publications are not meant to be, and do not constitute, financial, investment, trading, or other types of advice or recommendations supplied or endorsed by TradingView. Read more in the Terms of Use.
Disclaimer
The information and publications are not meant to be, and do not constitute, financial, investment, trading, or other types of advice or recommendations supplied or endorsed by TradingView. Read more in the Terms of Use.