Hi! I am have just entered into trading full time! I am not an expert and would like to connect with many people to help build my skill into mastery! All comments and feedback are welcomed!
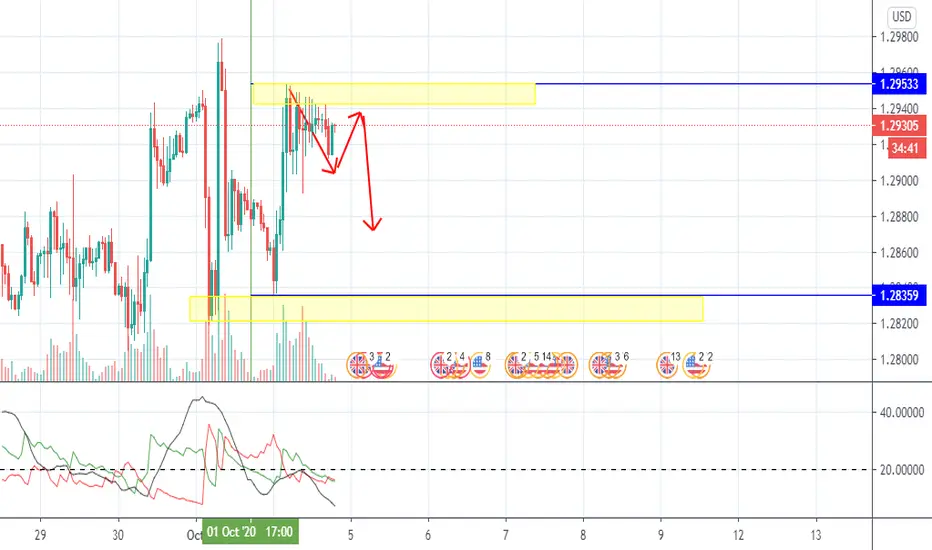
The blue lines that I have drawn up are from the previous trading day's high and low. Sometimes these line can be used for a support and resistance lines. I saw that GU had trouble trying to break past that high which indicated a potential sell. I do believe that before a decent sell off that it is going to try to test that are once more before heading towards that previous day low.
Also, I do not know how accurate this is, but I have heard of M's and W's that form in the market and that last leg is usually the "big drop". Finally, it looks as if the market is just bouncing in between this particular region since 9/28.
Disclaimer
The information and publications are not meant to be, and do not constitute, financial, investment, trading, or other types of advice or recommendations supplied or endorsed by TradingView. Read more in the Terms of Use.
Disclaimer
The information and publications are not meant to be, and do not constitute, financial, investment, trading, or other types of advice or recommendations supplied or endorsed by TradingView. Read more in the Terms of Use.