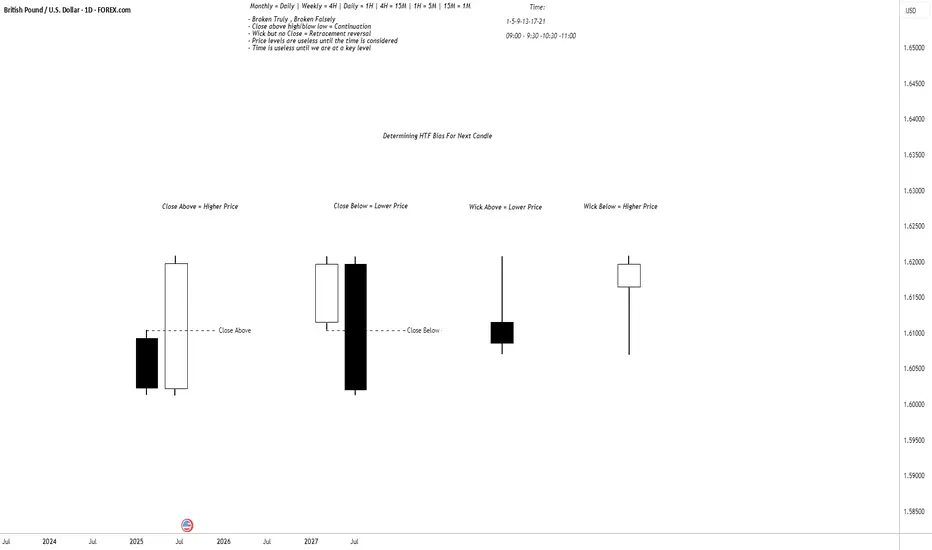
The image shows candlestick patterns for determining HTF bias for the next candle based on close and wick positions relative to price levels:
1. Close Above - Higher Price: White candle closing above a key level (bullish bias, suggests upward continuation).
2. Close Below - Lower Price: Black candle closing below a key level (bearish bias, suggests downward continuation).
3. Wick Above - Lower Price: Long upper wick rejected above a level (bearish bias, indicates seller control).
4. Wick Below - Higher Price: Long lower wick rejected below a level (bullish bias, indicates buyer support).
Disclaimer
The information and publications are not meant to be, and do not constitute, financial, investment, trading, or other types of advice or recommendations supplied or endorsed by TradingView. Read more in the Terms of Use.
Disclaimer
The information and publications are not meant to be, and do not constitute, financial, investment, trading, or other types of advice or recommendations supplied or endorsed by TradingView. Read more in the Terms of Use.