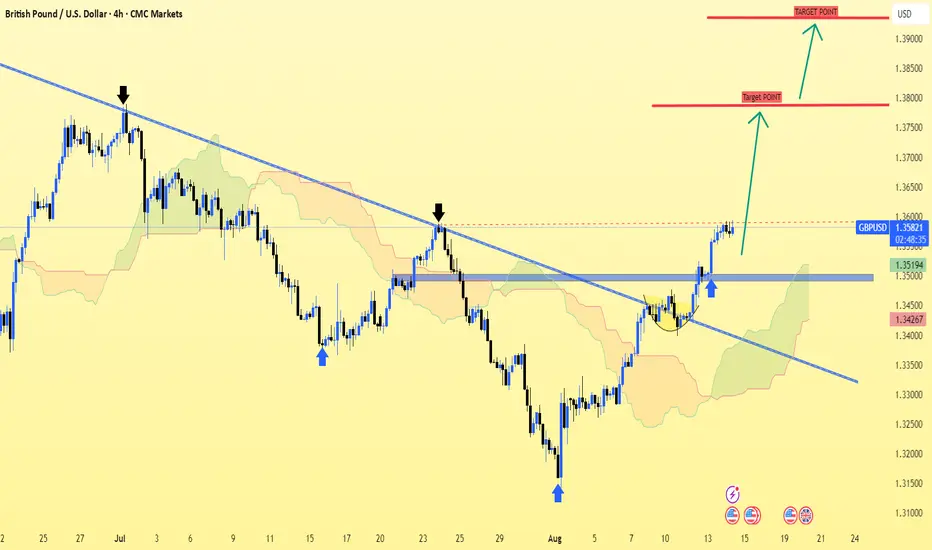
GBP/USD chart, here’s what the indicators and chart structure are showing:
Indicators & Price Action Used:
Trendline Breakout: Price has broken above a long-term descending trendline — bullish signal.
Ichimoku Cloud: Price is well above the cloud now, which suggests bullish momentum.
Support/Resistance Zones: Retest area around 1.3500–1.3550 has held as support after breakout.
Arrows & Target Labels: You’ve marked two upside “Target Point” zones.
Combined Targets using all indicators:
1. First Target: ~1.38000 – 1.38200 (minor resistance zone)
2. Second Target: ~1.39000 – 1.39200 (major resistance zone, your upper red line)
If price sustains above 1.3550 and stays above the cloud, the probability of reaching the first target is high. The second target would require strong continuation momentum and possibly a fundamental catalyst.
Trade active
trade active📲 Join telegram channel free ..
t.me/EU_USA_AND_CHAINA_TRADER
Forex, Gold & Crypto Signals with detailed analysis & get consistent results..
Gold Signal's with proper TP & SL for high profit ..
t.me/+GnRTz3YWKk9mZDM8
t.me/EU_USA_AND_CHAINA_TRADER
Forex, Gold & Crypto Signals with detailed analysis & get consistent results..
Gold Signal's with proper TP & SL for high profit ..
t.me/+GnRTz3YWKk9mZDM8
Related publications
Disclaimer
The information and publications are not meant to be, and do not constitute, financial, investment, trading, or other types of advice or recommendations supplied or endorsed by TradingView. Read more in the Terms of Use.
📲 Join telegram channel free ..
t.me/EU_USA_AND_CHAINA_TRADER
Forex, Gold & Crypto Signals with detailed analysis & get consistent results..
Gold Signal's with proper TP & SL for high profit ..
t.me/+GnRTz3YWKk9mZDM8
t.me/EU_USA_AND_CHAINA_TRADER
Forex, Gold & Crypto Signals with detailed analysis & get consistent results..
Gold Signal's with proper TP & SL for high profit ..
t.me/+GnRTz3YWKk9mZDM8
Related publications
Disclaimer
The information and publications are not meant to be, and do not constitute, financial, investment, trading, or other types of advice or recommendations supplied or endorsed by TradingView. Read more in the Terms of Use.