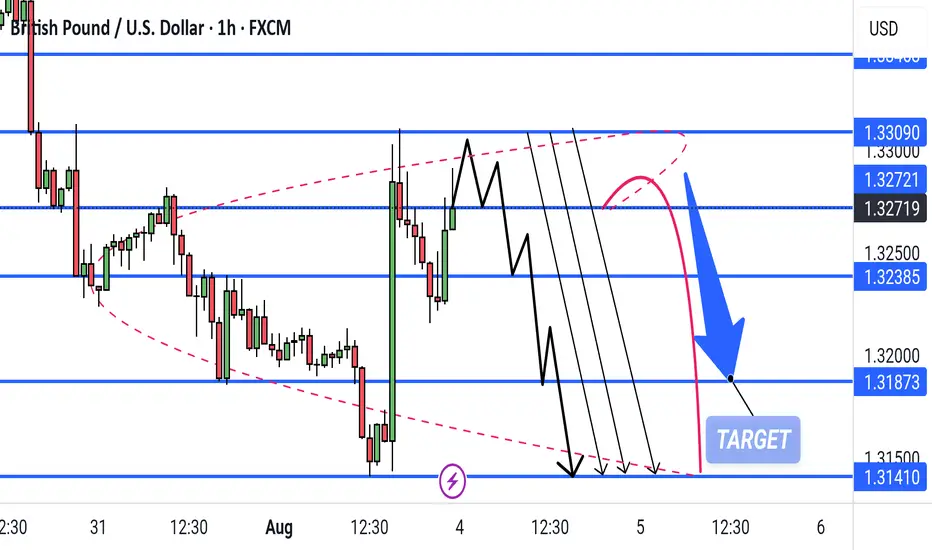
This is a 1-hour GBP/USD chart showing a bearish setup. Price is currently at resistance (1.32719) within a rising wedge pattern. Multiple black arrows suggest potential bearish breakdown scenarios targeting 1.31873, with a deeper drop possible toward 1.31410. The red path indicates a less likely bullish fakeout before reversal.
Disclaimer
The information and publications are not meant to be, and do not constitute, financial, investment, trading, or other types of advice or recommendations supplied or endorsed by TradingView. Read more in the Terms of Use.
Disclaimer
The information and publications are not meant to be, and do not constitute, financial, investment, trading, or other types of advice or recommendations supplied or endorsed by TradingView. Read more in the Terms of Use.