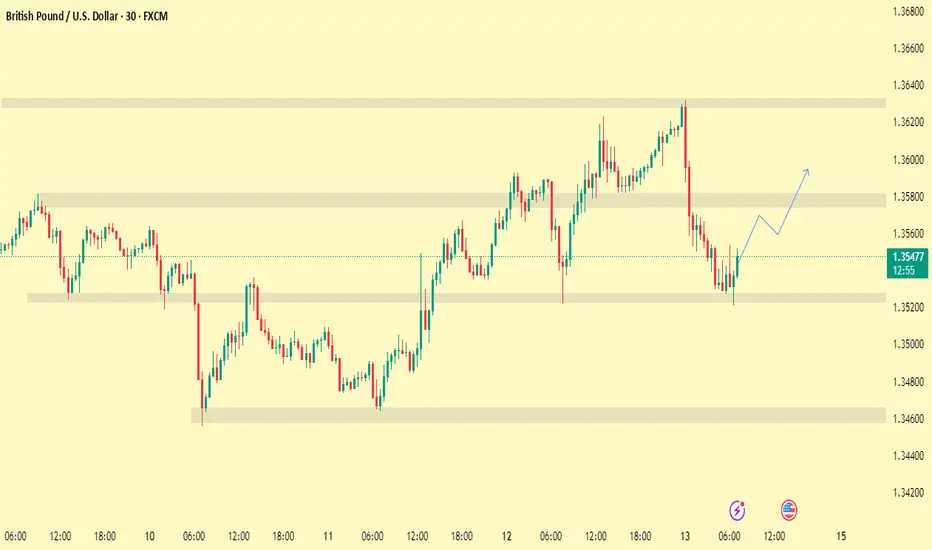
This 30-minute chart of GBP/USD highlights key support and resistance zones. After a sharp decline from the 1.36400 region, price action has rebounded off the 1.35200 support level. The projection suggests a potential short-term bullish move toward the 1.35800 resistance area, as indicated by the blue path. Traders should watch for confirmation of bullish momentum before entering long positions.
---
📈 GBP/USD Technical Analysis – June 13, 2025
Timeframe: 30-Minute
Pair: GBP/USD
Current Price: 1.35475
---
🔍 Key Observations:
1. Price Zones (Support & Resistance):
Support Zone: Around 1.35100 – 1.35250
This zone has shown strong demand in the past, and price has just bounced off this area.
Resistance Zone: Around 1.35750 – 1.35950
Price previously rejected this area after an upward rally, indicating active selling pressure.
---
2. Recent Price Action:
After a strong bearish impulse from the 1.36400 region, the pair formed a bullish rejection wick at the lower support zone.
A V-shaped recovery is forming, indicating possible short-term buyer strength.
The market has entered a retracement phase within a broader uptrend from earlier sessions.
---
3. Forecasted Movement:
The blue path on the chart suggests a potential bullish correction.
A possible short-term move could see price retest 1.35650 – 1.35800.
Price may consolidate slightly before breaking toward resistance.
If momentum holds, price could test the highs near 1.3600+ again.
---
4. Strategy Ideas:
🔵 Bullish Scenario:
Look for a pullback entry around 1.35350 – 1.35400 (if price retests minor intraday support).
Target: 1.35800
Stop-loss: Below 1.35200
🔴 Bearish Scenario:
If price fails to break 1.35800 and shows bearish engulfing or rejection, a short setup back to 1.35200 could emerge.
This would suggest a range-bound market or continued bearish pressure.
---
**5. Market Sentiment & Caution
---
📈 GBP/USD Technical Analysis – June 13, 2025
Timeframe: 30-Minute
Pair: GBP/USD
Current Price: 1.35475
---
🔍 Key Observations:
1. Price Zones (Support & Resistance):
Support Zone: Around 1.35100 – 1.35250
This zone has shown strong demand in the past, and price has just bounced off this area.
Resistance Zone: Around 1.35750 – 1.35950
Price previously rejected this area after an upward rally, indicating active selling pressure.
---
2. Recent Price Action:
After a strong bearish impulse from the 1.36400 region, the pair formed a bullish rejection wick at the lower support zone.
A V-shaped recovery is forming, indicating possible short-term buyer strength.
The market has entered a retracement phase within a broader uptrend from earlier sessions.
---
3. Forecasted Movement:
The blue path on the chart suggests a potential bullish correction.
A possible short-term move could see price retest 1.35650 – 1.35800.
Price may consolidate slightly before breaking toward resistance.
If momentum holds, price could test the highs near 1.3600+ again.
---
4. Strategy Ideas:
🔵 Bullish Scenario:
Look for a pullback entry around 1.35350 – 1.35400 (if price retests minor intraday support).
Target: 1.35800
Stop-loss: Below 1.35200
🔴 Bearish Scenario:
If price fails to break 1.35800 and shows bearish engulfing or rejection, a short setup back to 1.35200 could emerge.
This would suggest a range-bound market or continued bearish pressure.
---
**5. Market Sentiment & Caution
Trade active
Trade closed: target reached
Disclaimer
The information and publications are not meant to be, and do not constitute, financial, investment, trading, or other types of advice or recommendations supplied or endorsed by TradingView. Read more in the Terms of Use.
Disclaimer
The information and publications are not meant to be, and do not constitute, financial, investment, trading, or other types of advice or recommendations supplied or endorsed by TradingView. Read more in the Terms of Use.