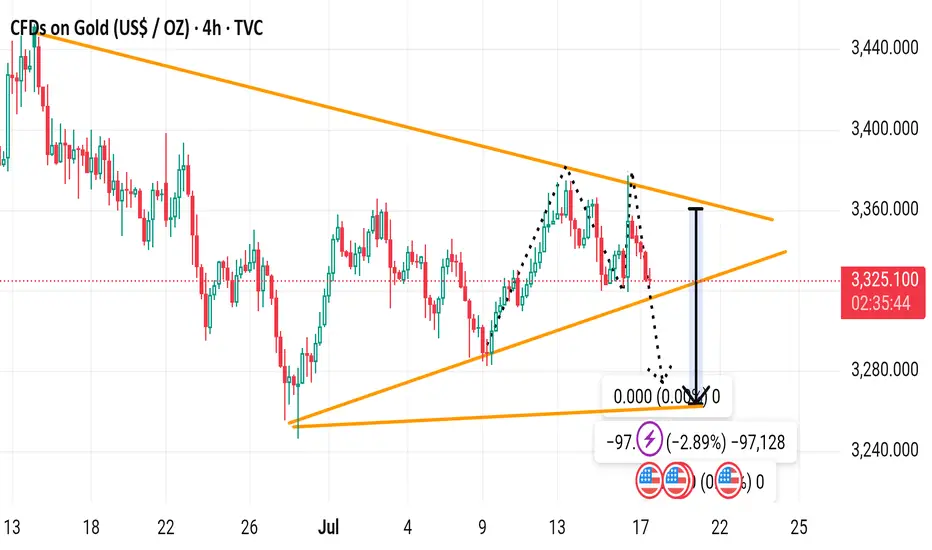
This second chart shows a 4-hour timeframe analysis of Gold CFDs (XAU/USD), focusing on a potential symmetrical triangle pattern and an expected breakout move.
---
Key Observations
🔸 Chart Pattern: Symmetrical Triangle
Formed by converging lower highs and higher lows.
Indicates price compression — a breakout is likely soon.
Price is currently near the apex of the triangle.
---
Current Price
3,326.990, down -20.677 (-0.62%)
---
Bearish Breakout Bias
The chart highlights a potential downward breakout.
Arrow shows a projected drop of ~97 points from triangle support.
This move targets the 3,230 area, suggesting a ~2.89% decline from the breakout point.
---
Dotted Arrows & Markers
Dotted lines show the breakdown steps.
U.S. flag icons likely indicate upcoming economic events (possibly high-impact ones like Fed announcements or CPI).
---
Conclusion & Strategy Implications
Triangle nearing breakout point: Expect volatility soon.
Bearish scenario favored, targeting ~3,230.
If price reclaims upper trendline (~3,350+), the bearish setup invalidates and a bullish breakout may follow instead.
---
Would you like a detailed trading plan (entry, SL, TP) based on either breakout direction?
---
Key Observations
🔸 Chart Pattern: Symmetrical Triangle
Formed by converging lower highs and higher lows.
Indicates price compression — a breakout is likely soon.
Price is currently near the apex of the triangle.
---
Current Price
3,326.990, down -20.677 (-0.62%)
---
Bearish Breakout Bias
The chart highlights a potential downward breakout.
Arrow shows a projected drop of ~97 points from triangle support.
This move targets the 3,230 area, suggesting a ~2.89% decline from the breakout point.
---
Dotted Arrows & Markers
Dotted lines show the breakdown steps.
U.S. flag icons likely indicate upcoming economic events (possibly high-impact ones like Fed announcements or CPI).
---
Conclusion & Strategy Implications
Triangle nearing breakout point: Expect volatility soon.
Bearish scenario favored, targeting ~3,230.
If price reclaims upper trendline (~3,350+), the bearish setup invalidates and a bullish breakout may follow instead.
---
Would you like a detailed trading plan (entry, SL, TP) based on either breakout direction?
t.me/+EQ88IkMSUvQwMGJk
Join telegram channel free
t.me/+EQ88IkMSUvQwMGJk
Join telegram channel free
t.me/+EQ88IkMSUvQwMGJk
Disclaimer
The information and publications are not meant to be, and do not constitute, financial, investment, trading, or other types of advice or recommendations supplied or endorsed by TradingView. Read more in the Terms of Use.
t.me/+EQ88IkMSUvQwMGJk
Join telegram channel free
t.me/+EQ88IkMSUvQwMGJk
Join telegram channel free
t.me/+EQ88IkMSUvQwMGJk
Disclaimer
The information and publications are not meant to be, and do not constitute, financial, investment, trading, or other types of advice or recommendations supplied or endorsed by TradingView. Read more in the Terms of Use.