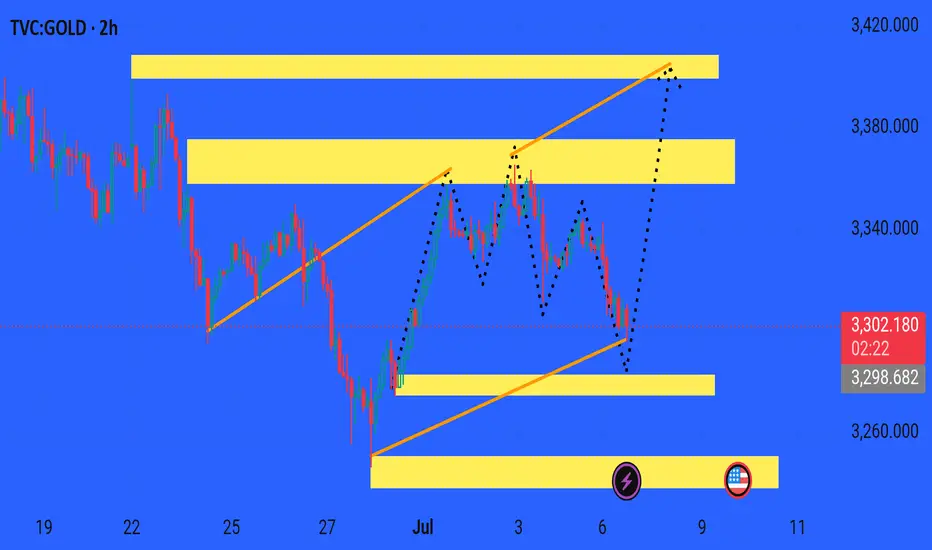
This chart shows a 2-hour timeframe of Gold CFDs (XAU/USD) with technical analysis, highlighting recent price action, support/resistance zones, and potential market structure.
Here’s a breakdown:
---
🔍 Current Price
Price: $3,301.334
Change: -24.086 (-0.72%)
---
📉 Trend Overview
Price broke downward from a rising wedge, a typically bearish pattern.
There's a clear lower high and lower low forming — suggesting short-term bearish pressure.
---
🟡 Key Zones
1. Resistance Zones
$3,404 (marked in red): Strong resistance — price previously rejected from here.
$3,360–$3,404: Upper supply zone, recent price peak.
2. Support Zones
$3,298–$3,276 (grey & yellow): Immediate support — price is testing this region.
Below $3,276: Stronger demand zone where price may bounce if current support breaks.
---
📈 Scenarios
1. Bullish Bounce Possibility
If price holds above $3,276, a retracement or short-term reversal back toward $3,360 is likely (indicated by dotted bullish projection).
A strong breakout above $3,360 could lead to retesting $3,404+.
2. Bearish Continuation
If price breaks below $3,276, it may target lower support levels.
Bearish momentum is visible via dotted downtrend steps.
---
📌 Chart Features
Orange trend lines: Define the former rising wedge.
Dotted lines: Suggest possible future price paths (up/down).
Yellow zones: Major supply and demand levels.
Icons (lightning, grid): Possibly mark news/events or high-impact zones.
---
🔮 Summary
Currently, Gold is in a short-term bearish correction but is approaching a critical support zone at $3,276. Watch for:
A bounce = bullish retracement toward $3,360–$3,404.
A breakdown = continuation of the bearish trend.
Would you like an update on potential entry/exit signals or Fibonacci retracement levels for this move?
t.me/+EQ88IkMSUvQwMGJk
Join telegram channel free
t.me/+EQ88IkMSUvQwMGJk
Join telegram channel free
t.me/+EQ88IkMSUvQwMGJk
Disclaimer
The information and publications are not meant to be, and do not constitute, financial, investment, trading, or other types of advice or recommendations supplied or endorsed by TradingView. Read more in the Terms of Use.
t.me/+EQ88IkMSUvQwMGJk
Join telegram channel free
t.me/+EQ88IkMSUvQwMGJk
Join telegram channel free
t.me/+EQ88IkMSUvQwMGJk
Disclaimer
The information and publications are not meant to be, and do not constitute, financial, investment, trading, or other types of advice or recommendations supplied or endorsed by TradingView. Read more in the Terms of Use.