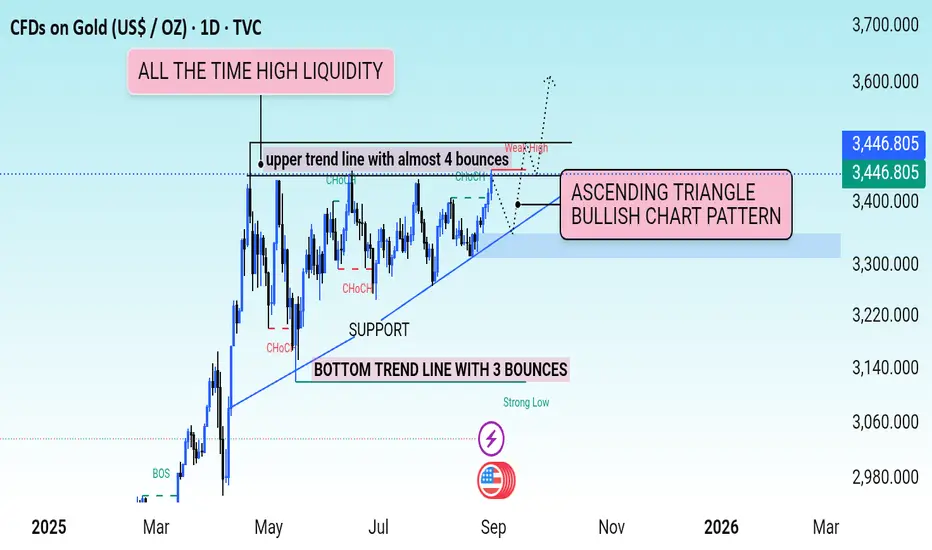
🔹 Ascending Triangle Formation
The chart shows gold forming an ascending triangle pattern, with a bottom trendline (3 bounces = strong support) and an upper resistance trendline (tested 4 times).
This is a classic bullish continuation pattern, suggesting a potential upside breakout.
🔹 Key Levels
Current price is around 3,446.
All-time high liquidity zone lies above, which is the next major target area.
Strong support zone around 3,200 – 3,250.
🔹 Price Action Signals
Price continues to bounce from support, confirming strong buying pressure.
The upper resistance (weak high) has been tested multiple times, which increases the likelihood of a breakout.
A successful breakout above resistance could lead to new all-time highs.
📈 Professional Outlook (Bullish Bias)
As long as 3,200 support holds, gold remains in a bullish structure. A confirmed breakout from the ascending triangle could push gold towards 3,600 initially, followed by 3,750 – 3,800 levels.
👉 Overall, the chart supports a long-term bullish trend and favors a buy-on-dips strategy.
Trade with confirmation.
Xauusd+BTCUSD trade with GOLD TRADE MASTER swing sniper entires.
Xauusd+BTCUSD trade with GOLD TRADE MASTER swing sniper entires.
Disclaimer
The information and publications are not meant to be, and do not constitute, financial, investment, trading, or other types of advice or recommendations supplied or endorsed by TradingView. Read more in the Terms of Use.