The Gold price trades in negative territory on the day. The bullish tone of the precious metal remains intact in the longer term, with the price holding above the key 100-day Exponential Moving Average (EMA) on the daily chart. The upward momentum is supported by the 14-day Relative Strength Index (RSI), which stands above the midline near 60.50. This displays the bullish momentum in the near term.
The upper boundary of the Bollinger Band of $3,425 acts as an immediate resistance level for XAU/USD. Sustained trading above this level could take the yellow metal to $3,439, the high of July 23. The next upside target to watch is $3,500, the psychological level and the high of April 22.
On the downside, the initial support level for Gold is seen at $3,373, the low of August 27. Red candlesticks closing below the mentioned level could expose $3,351, the low of August 26. The additional downside filter is located at $3,310, the lower limit of the Bollinger Band.
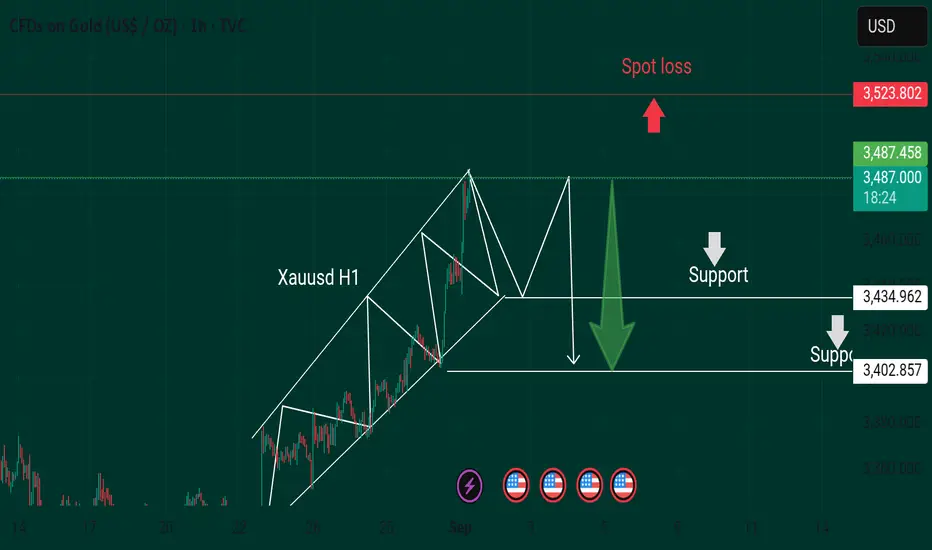
Xauusd signal sell 3488
Support 3460
Support 3440
Support 3420
Stop loss 3530
The upper boundary of the Bollinger Band of $3,425 acts as an immediate resistance level for XAU/USD. Sustained trading above this level could take the yellow metal to $3,439, the high of July 23. The next upside target to watch is $3,500, the psychological level and the high of April 22.
On the downside, the initial support level for Gold is seen at $3,373, the low of August 27. Red candlesticks closing below the mentioned level could expose $3,351, the low of August 26. The additional downside filter is located at $3,310, the lower limit of the Bollinger Band.
Xauusd signal sell 3488
Support 3460
Support 3440
Support 3420
Stop loss 3530
Trade active
Xauusd signal sell 140 pips running Trade closed: target reached
Xauusd signal sell 200 pips signal sell Note
Xauusd signal sell Note
Xauusd next target 3420 Note
Xauusd signal sell Note
Next target 3350Note
Xauusd sell Note
Gold sell signal Disclaimer
The information and publications are not meant to be, and do not constitute, financial, investment, trading, or other types of advice or recommendations supplied or endorsed by TradingView. Read more in the Terms of Use.
Disclaimer
The information and publications are not meant to be, and do not constitute, financial, investment, trading, or other types of advice or recommendations supplied or endorsed by TradingView. Read more in the Terms of Use.