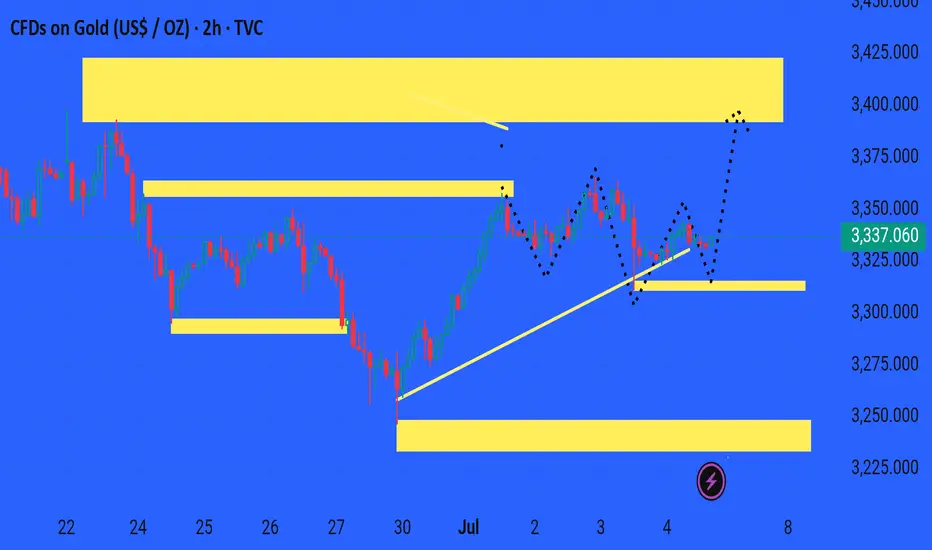
This chart shows a bullish outlook for Gold (CFDs on Gold in USD/OZ) on the 2-hour timeframe, as created on July 5, 2025. Here's a breakdown of key elements:
---
🔍 Technical Analysis Summary:
1. Current Price: 3,337.060
2. Key Zones:
Support Zones:
Around 3,320.000: A strong horizontal support area.
Around 3,240.000: Major demand zone where a previous reversal occurred.
Resistance Zones:
Around 3,360.000: Minor resistance.
3,400.000 – 3,440.000: Strong supply/resistance zone, likely a target area.
3. Trendline Support:
An ascending trendline supports the bullish structure, connecting recent higher lows.
4. Expected Price Movement:
The dotted black arrows show two potential bullish scenarios:
Scenario 1: A short pullback to the trendline/support (~3,320) followed by a rally.
Scenario 2: Continuation from current levels toward the 3,400–3,440 resistance.
5. Volume/Volatility Note:
The purple lightning bolt icon near the 3,240 area suggests a high-volatility point, possibly a strong reaction zone.
---
📈 Bullish Bias Rationale:
Strong structure of higher highs and higher lows.
Price respecting trendline support.
Large bullish candle cluster after bottoming around June 30.
Market is pushing toward untested resistance at the top yellow box.
---
🟢 Outlook:
As long as price stays above 3,320 support and respects the rising trendline, the bias remains bullish.
Break above 3,360 could trigger a rally toward 3,400–3,440.
Would you like a stop-loss/take-profit suggestion based on this setup?
---
🔍 Technical Analysis Summary:
1. Current Price: 3,337.060
2. Key Zones:
Support Zones:
Around 3,320.000: A strong horizontal support area.
Around 3,240.000: Major demand zone where a previous reversal occurred.
Resistance Zones:
Around 3,360.000: Minor resistance.
3,400.000 – 3,440.000: Strong supply/resistance zone, likely a target area.
3. Trendline Support:
An ascending trendline supports the bullish structure, connecting recent higher lows.
4. Expected Price Movement:
The dotted black arrows show two potential bullish scenarios:
Scenario 1: A short pullback to the trendline/support (~3,320) followed by a rally.
Scenario 2: Continuation from current levels toward the 3,400–3,440 resistance.
5. Volume/Volatility Note:
The purple lightning bolt icon near the 3,240 area suggests a high-volatility point, possibly a strong reaction zone.
---
📈 Bullish Bias Rationale:
Strong structure of higher highs and higher lows.
Price respecting trendline support.
Large bullish candle cluster after bottoming around June 30.
Market is pushing toward untested resistance at the top yellow box.
---
🟢 Outlook:
As long as price stays above 3,320 support and respects the rising trendline, the bias remains bullish.
Break above 3,360 could trigger a rally toward 3,400–3,440.
Would you like a stop-loss/take-profit suggestion based on this setup?
t.me/+EQ88IkMSUvQwMGJk
Join telegram channel free
t.me/+EQ88IkMSUvQwMGJk
Join telegram channel free
t.me/+EQ88IkMSUvQwMGJk
Disclaimer
The information and publications are not meant to be, and do not constitute, financial, investment, trading, or other types of advice or recommendations supplied or endorsed by TradingView. Read more in the Terms of Use.
t.me/+EQ88IkMSUvQwMGJk
Join telegram channel free
t.me/+EQ88IkMSUvQwMGJk
Join telegram channel free
t.me/+EQ88IkMSUvQwMGJk
Disclaimer
The information and publications are not meant to be, and do not constitute, financial, investment, trading, or other types of advice or recommendations supplied or endorsed by TradingView. Read more in the Terms of Use.