Gold (XAU/USD) 1H Chart Analysis – July 30, 2025 Setup Overview:
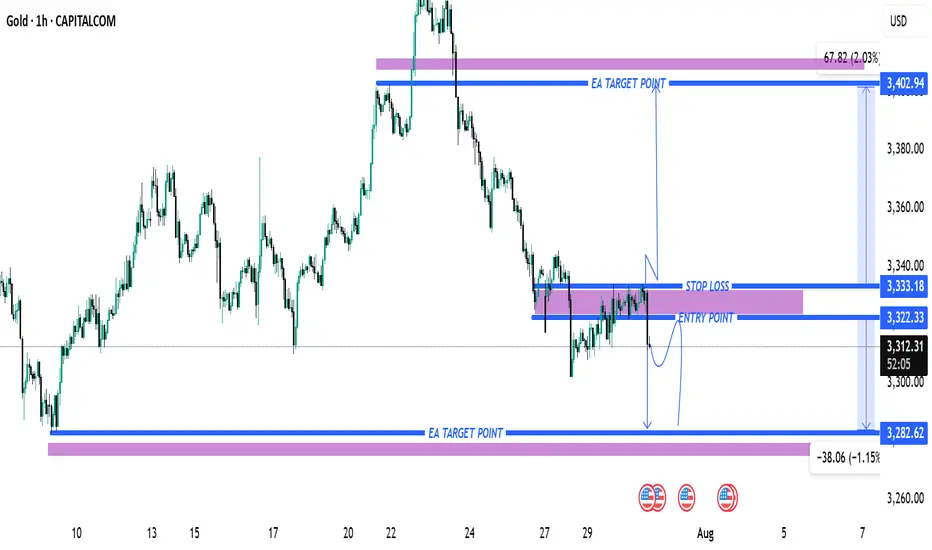
The chart suggests a pending breakout scenario, with potential long and short trade setups based on a key zone between $3,322.33 (ENTRY POINT) and $3,333.18 (STOPLOSS)KeyZoneAnalysis:ENTRY POINT: $3,322.33STOP LOSS (above): $3,333.18This zone is marked as a resistance-turned-decision area, where the price is consolidating.Two PossibleScenarios: Scenario 1: Bearish RejectionPrice Action: If the price respects theresistanceand breaks downward from the zone:Target: $3,282.62 (marked as"EATARGETPOINT")Potential Move: -38.06 pts (-1.15%)
🔼 Scenario 2: Bullish Breakout
Price Action: If the price breaks and closes above the stop loss level:
Target: $3,402.94 (upper “EA TARGET POINT”)
Potential Move: +67.82 pts (+2.03%)
📌 Technical Summary:
Parameter Value
Entry Level 3,322.33
Stop Loss 3,333.18
Bearish Target 3,282.62
Bullish Target 3,402.94
📊 Conclusion:
This chart shows a consolidation near resistance, waiting for a breakout or rejection confirmation. Traders may:
Enter short if a bearish engulfing or rejection candle forms.
Enter long if there's a break and close above $3,333.18 with volume confirmation.
Trade active
Join my telegram (COPY_TRADE)
t.me/TOP1INVEESTADMEN
Join my refrel broker link
one.exnesstrack.org/a/l1t1rf3p6v
t.me/TOP1INVEESTADMEN
Join my refrel broker link
one.exnesstrack.org/a/l1t1rf3p6v
Disclaimer
The information and publications are not meant to be, and do not constitute, financial, investment, trading, or other types of advice or recommendations supplied or endorsed by TradingView. Read more in the Terms of Use.