Gold (XAU/USD) Technical Analysis
Date: July 28, 2025
Market Context
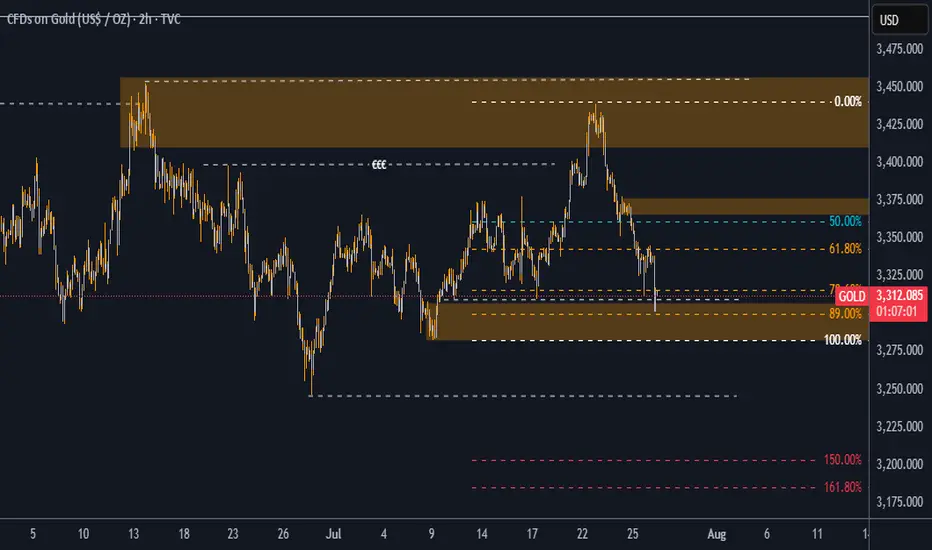
Gold (XAU/USD) is currently trading at $3,313.01, showing a modest gain of +0.32% on the day. From a Smart Money Concepts (SMC) perspective, price action is now positioned at a high-probability demand zone, presenting an attractive opportunity for long positions.
Key Technical Observations
Liquidity Grab at $3,308
Price has recently swept the liquidity resting below $3,308, indicating the possible completion of a stop-hunt move orchestrated by institutional players. This move created an ideal setup for a bullish reversal from a zone where weak longs have been shaken out.
Discounted Price Zone (89% Fibonacci)
The market has retraced deeply into a discounted region, reaching the 89% Fibonacci retracement level of the most recent bullish leg. This zone coincides with a previously identified demand block, enhancing the confluence for potential bullish continuation.
Market Structure & Order Blocks
The current structure shows a bullish intent with price revisiting a bullish order block that previously led to a strong rally. The reaction from this block is key—holding above $3,300 would confirm buyers stepping in with conviction.
Internal Liquidity Void (Imbalance)
A visible inefficiency (price imbalance) exists between $3,345 and $3,398, acting as a magnet for price in the short-to-mid term. This inefficiency aligns perfectly with SMC principles that favor price filling these voids.
Bullish Targets
If price holds and confirms bullish intent from the current zone, we expect a move toward the following key levels:
Target 1: $3,345
This is the midpoint of a previous consolidation range and also lies just above the 50% Fibonacci level.
It also aligns with a minor supply area and could serve as a first TP level.
Target 2: $3,398
This is the upper bound of a key supply zone that previously initiated a strong sell-off.
It coincides with the 0.00% Fib retracement, marking the origin of the most recent bearish leg.
Date: July 28, 2025
Market Context
Gold (XAU/USD) is currently trading at $3,313.01, showing a modest gain of +0.32% on the day. From a Smart Money Concepts (SMC) perspective, price action is now positioned at a high-probability demand zone, presenting an attractive opportunity for long positions.
Key Technical Observations
Liquidity Grab at $3,308
Price has recently swept the liquidity resting below $3,308, indicating the possible completion of a stop-hunt move orchestrated by institutional players. This move created an ideal setup for a bullish reversal from a zone where weak longs have been shaken out.
Discounted Price Zone (89% Fibonacci)
The market has retraced deeply into a discounted region, reaching the 89% Fibonacci retracement level of the most recent bullish leg. This zone coincides with a previously identified demand block, enhancing the confluence for potential bullish continuation.
Market Structure & Order Blocks
The current structure shows a bullish intent with price revisiting a bullish order block that previously led to a strong rally. The reaction from this block is key—holding above $3,300 would confirm buyers stepping in with conviction.
Internal Liquidity Void (Imbalance)
A visible inefficiency (price imbalance) exists between $3,345 and $3,398, acting as a magnet for price in the short-to-mid term. This inefficiency aligns perfectly with SMC principles that favor price filling these voids.
Bullish Targets
If price holds and confirms bullish intent from the current zone, we expect a move toward the following key levels:
Target 1: $3,345
This is the midpoint of a previous consolidation range and also lies just above the 50% Fibonacci level.
It also aligns with a minor supply area and could serve as a first TP level.
Target 2: $3,398
This is the upper bound of a key supply zone that previously initiated a strong sell-off.
It coincides with the 0.00% Fib retracement, marking the origin of the most recent bearish leg.
Disclaimer
The information and publications are not meant to be, and do not constitute, financial, investment, trading, or other types of advice or recommendations supplied or endorsed by TradingView. Read more in the Terms of Use.
Disclaimer
The information and publications are not meant to be, and do not constitute, financial, investment, trading, or other types of advice or recommendations supplied or endorsed by TradingView. Read more in the Terms of Use.