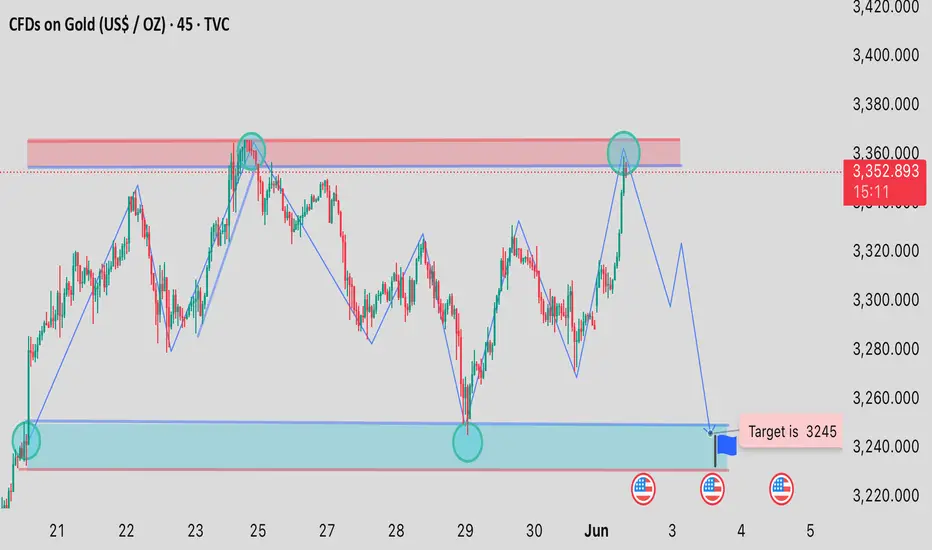
This chart presents a technical analysis of Gold (XAU/USD) on the 45-minute timeframe. Here’s a breakdown of the analysis and key insights:
⸻
🟢 Current Price Action
• Current Price: $3,351.833
• Recent Move: Sharp upward movement (+1.92%) suggesting a short-term bullish surge.
⸻
📈 Key Levels Identified
1. Resistance Zone (Red Box):
• Located near the $3,375–$3,355 range.
• Price has previously rejected this zone (circled area), forming a double top pattern, which is a bearish reversal signal.
• Price recently touched this area again, implying another potential rejection.
2. Support Zone (Blue Box):
• Located around the $3,245 level.
• Marked as the target zone on the chart.
• Has been tested multiple times previously, validating it as a strong support level.
⸻
🔁 Price Structure
• The chart shows a range-bound market with price oscillating between the resistance and support zones.
• Previous price movements suggest lower highs and lower lows, indicating bearish pressure after testing the upper boundary.
⸻
📉 Projected Move (Blue Arrows)
• Bearish scenario anticipated:
• A minor pullback from the resistance zone.
• Continuation downward toward the support zone.
• Final target marked at $3,245, aligning with previous demand and support.
⸻
⚠️ Possible Trade Setup
• Short Position Idea:
• Entry: Near resistance ($3,355–$3,375)
• Target: $3,245
• Stop Loss: Just above the resistance zone to protect against a breakout.
⸻
🟢 Current Price Action
• Current Price: $3,351.833
• Recent Move: Sharp upward movement (+1.92%) suggesting a short-term bullish surge.
⸻
📈 Key Levels Identified
1. Resistance Zone (Red Box):
• Located near the $3,375–$3,355 range.
• Price has previously rejected this zone (circled area), forming a double top pattern, which is a bearish reversal signal.
• Price recently touched this area again, implying another potential rejection.
2. Support Zone (Blue Box):
• Located around the $3,245 level.
• Marked as the target zone on the chart.
• Has been tested multiple times previously, validating it as a strong support level.
⸻
🔁 Price Structure
• The chart shows a range-bound market with price oscillating between the resistance and support zones.
• Previous price movements suggest lower highs and lower lows, indicating bearish pressure after testing the upper boundary.
⸻
📉 Projected Move (Blue Arrows)
• Bearish scenario anticipated:
• A minor pullback from the resistance zone.
• Continuation downward toward the support zone.
• Final target marked at $3,245, aligning with previous demand and support.
⸻
⚠️ Possible Trade Setup
• Short Position Idea:
• Entry: Near resistance ($3,355–$3,375)
• Target: $3,245
• Stop Loss: Just above the resistance zone to protect against a breakout.
Disclaimer
The information and publications are not meant to be, and do not constitute, financial, investment, trading, or other types of advice or recommendations supplied or endorsed by TradingView. Read more in the Terms of Use.
Disclaimer
The information and publications are not meant to be, and do not constitute, financial, investment, trading, or other types of advice or recommendations supplied or endorsed by TradingView. Read more in the Terms of Use.