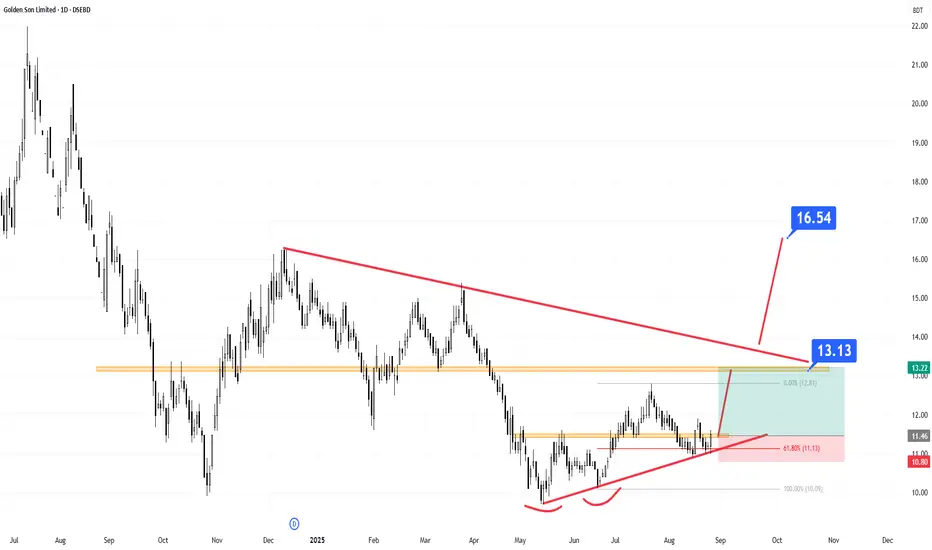
The stock has recently bounced from a short-term trendline. Not just once, but twice in the last 8 trading sessions, confirming the strength and reliability of this trendline.
On the daily chart, GOLDENSON has formed a double bottom pattern and is now trading at the neckline retest area. Technically, this is considered a strong Blind Buy Zone.
Moreover, the stock has retraced to the 61.8% Fibonacci retracement level of its last bullish wave, which is typically regarded as a strong reversal zone.
Targets:
Initial Target: ৳13.50 (approx. 15% upside potential)
Extended Target: ৳16.50+ (if a strong breakout occurs)
Summary:
Golden Son is currently at a powerful technical support zone. The confluence of the trendline support, double bottom formation, and Fibonacci retracement makes this a potential high-probability trade setup.
Disclaimer
The information and publications are not meant to be, and do not constitute, financial, investment, trading, or other types of advice or recommendations supplied or endorsed by TradingView. Read more in the Terms of Use.
Disclaimer
The information and publications are not meant to be, and do not constitute, financial, investment, trading, or other types of advice or recommendations supplied or endorsed by TradingView. Read more in the Terms of Use.