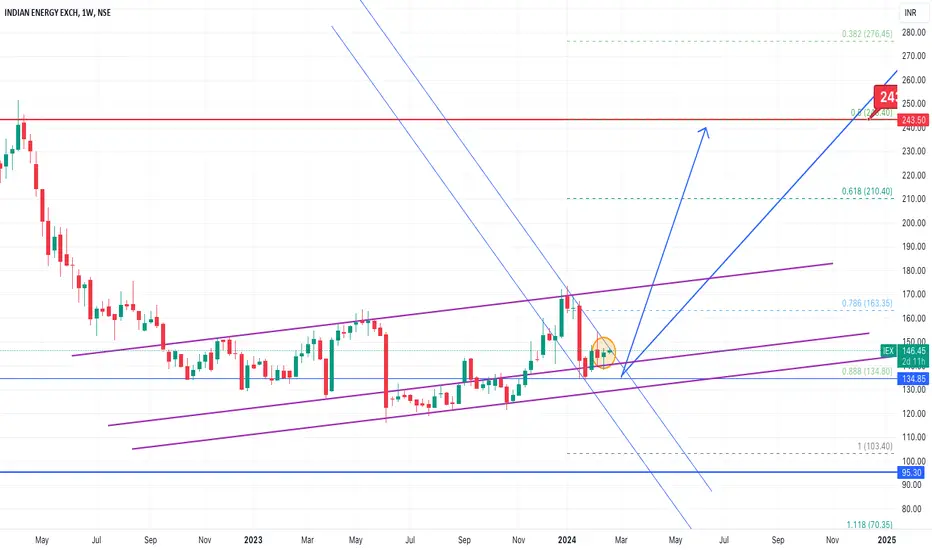
By seeing IEX chart pattern it is forming a doji buy signal on weekly also tries to breakout, looks like it has more chance to test 240 and 350 in 4years, on downside if it break 130 it has chance to test 95, lets see if this works
Target1: 243
Target2: 350
Support: 130
Down side Target if 130 break: 95
Target1: 243
Target2: 350
Support: 130
Down side Target if 130 break: 95
Note
looks like taking supportTrade closed: stop reached
Trade active
looks like moving good, lets seeNote
respecting the trend linesNote
testing support and moving forwardNote
fantastic move, last week 9.85% and this week so far 3.45%Note
taking support above the trend lineNote
near to targetTrade closed: target reached
target achievedNote
Seems like 192 might be a good support, if it is respected chances to test 224 and 257 this quarter, lets see Related publications
Disclaimer
The information and publications are not meant to be, and do not constitute, financial, investment, trading, or other types of advice or recommendations supplied or endorsed by TradingView. Read more in the Terms of Use.
Related publications
Disclaimer
The information and publications are not meant to be, and do not constitute, financial, investment, trading, or other types of advice or recommendations supplied or endorsed by TradingView. Read more in the Terms of Use.