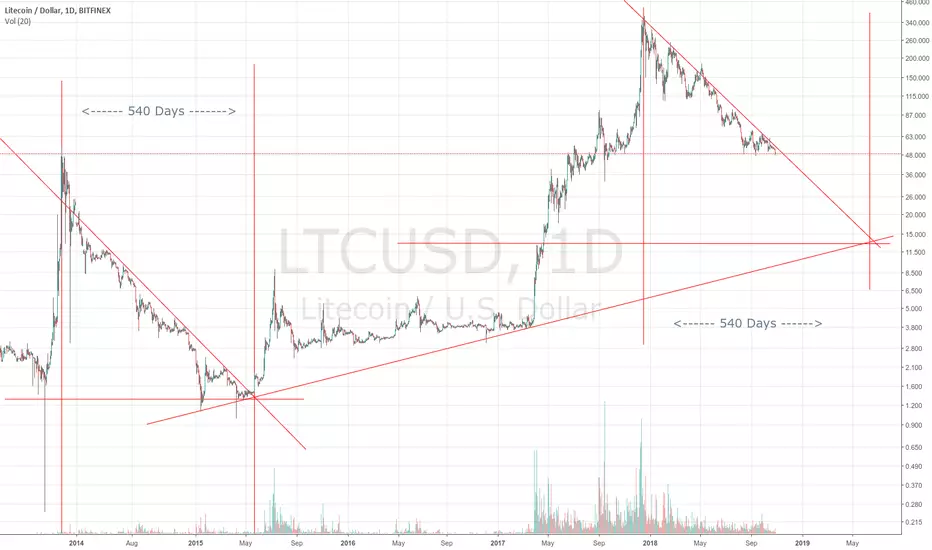
The pattern is repeating, straight line down on the log chart.
Last down move lasted 540 days. If this trend keeps up it will end at 13 dollar.
Interestingly there is an uptrend that can be established there.
So I foresee solid support and probably a rapid upswing towards 50 from there.
But first we go down.
370 to 13 would represent a 96.5% decline.
Slightly less severe than the almost 98% decline in the first bear market.
(For the attentive observers: Both time periods do not look as long as the other, that is due to some data missing from early 2014. This data is available on bitcoinwisdom and you could replicate this chart if you would so wish. The first bear market will then represent a straight line down even better.)
Disclaimer
The information and publications are not meant to be, and do not constitute, financial, investment, trading, or other types of advice or recommendations supplied or endorsed by TradingView. Read more in the Terms of Use.
Disclaimer
The information and publications are not meant to be, and do not constitute, financial, investment, trading, or other types of advice or recommendations supplied or endorsed by TradingView. Read more in the Terms of Use.