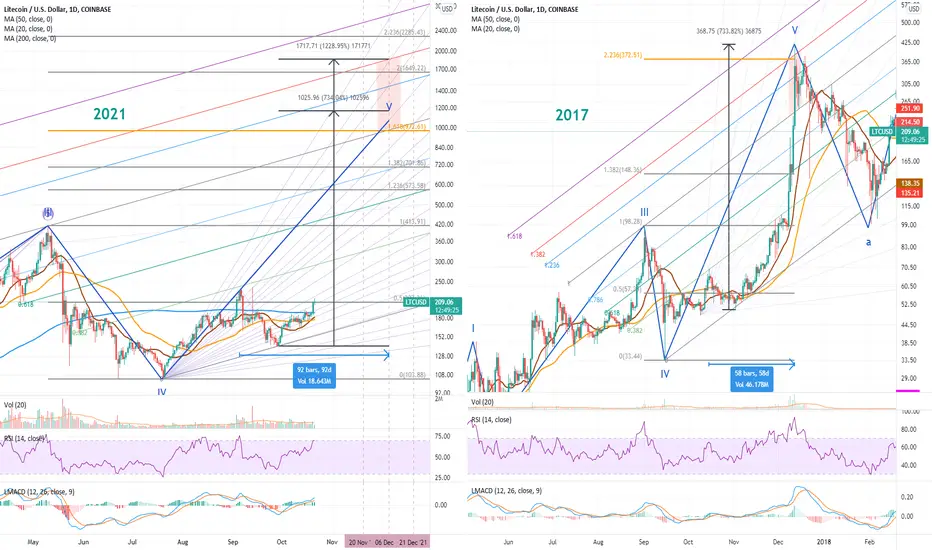
In this study I present a comparison between the 2017 market on the right and the 2021 market on the left. There are numerous similarities, with a Fibonacci Channel defining the structure in both periods.
What do you think, are there similarities? If so, what does that mean?
What do you think, are there similarities? If so, what does that mean?
Disclaimer
The information and publications are not meant to be, and do not constitute, financial, investment, trading, or other types of advice or recommendations supplied or endorsed by TradingView. Read more in the Terms of Use.
Disclaimer
The information and publications are not meant to be, and do not constitute, financial, investment, trading, or other types of advice or recommendations supplied or endorsed by TradingView. Read more in the Terms of Use.