LTC- LitCoin - This is how a Fake Break on Fib looks like
This is how a Fake Break on Fib looks like using Weis Wave with Speed Index
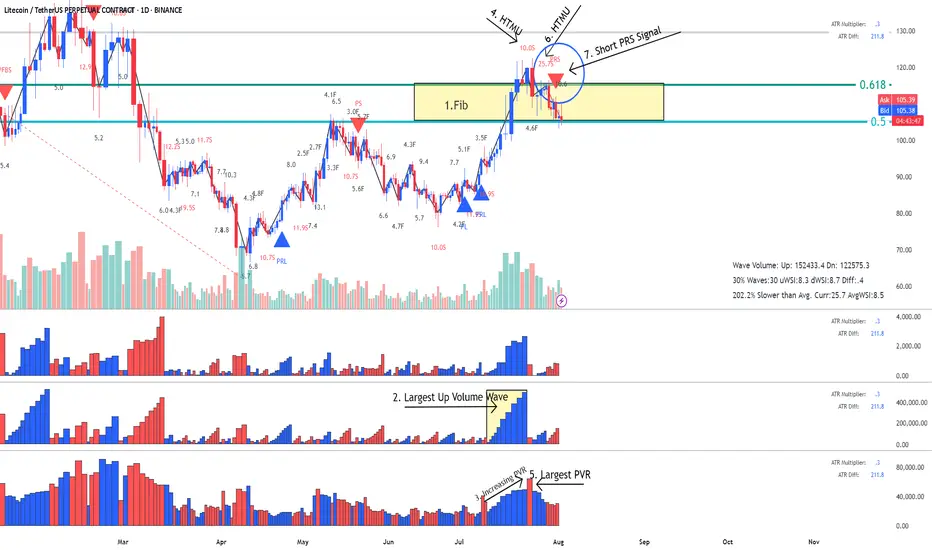
Reading the Daily Chart
1. Fib Location - Sellers could enter here
2. Largest Up volume wave after a while - also sellers could be hidden in there.
3. Increasing PVR (progressing volume rate) = as we approve the top more volume comes in (sellers)
4. This up wave has the highest Speed Index 10.0S of all the up waves in the trend, that's a HTMU (hard to move up = sellers)
5. The highest PVR bar =sellers
6. Another Abnormal Speed Index 25.5 S - that's another HTMU = more sellers on the up move, price cannot progress upward anymore.
7. and finally down we go with a PRS signal.
All the ingredients for the Short were there. Reading Weis Wave with Speed Index is like reading a book, page after page, until you reach to the last page that the writer has kept the surprise, the only difference is that this is never ending chart book with many stories. This was the story of LTC for now. I think this story has not ended yet and continue to drop to another Fib, the details on the 1HR!.
I hope you enjoy this chart reading lesson using Weis Wave with Speed Index.
Contact:info@tradethevolumeswaves.com
Site: tradethevolumewaves.com
Lesson 15: youtu.be/QPG59GWr5HQ?si=joaRCJgvyo-L2ntM
Site: tradethevolumewaves.com
Lesson 15: youtu.be/QPG59GWr5HQ?si=joaRCJgvyo-L2ntM
Disclaimer
The information and publications are not meant to be, and do not constitute, financial, investment, trading, or other types of advice or recommendations supplied or endorsed by TradingView. Read more in the Terms of Use.