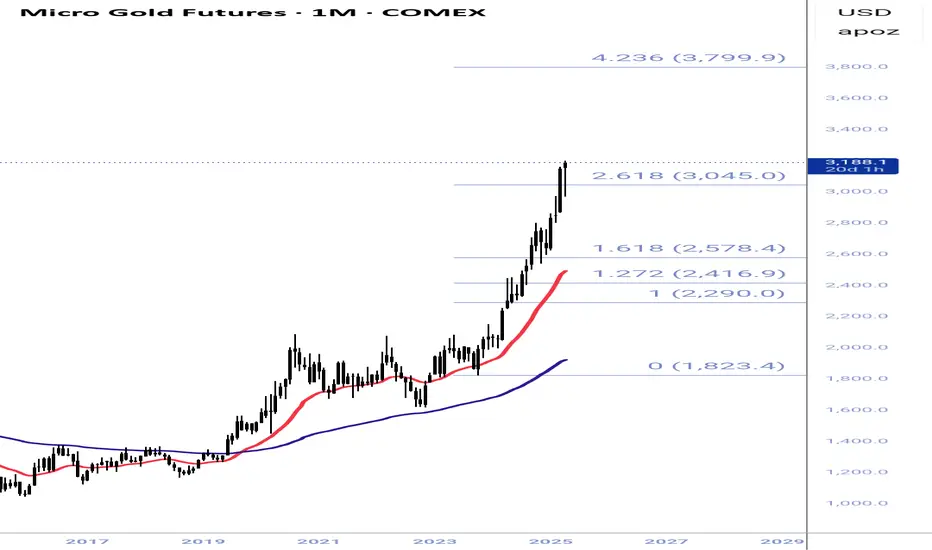
As gold hit a high today I took a look at the chart. Incredible run going back many years. But what goes up must come down. Based on a Fib-extension we can see where price has hit resistance and turned it into support. It happened at 1, 1.272, 1.618, and briefly at 2.618. It has remarkably pushed through that. So in my studies of markets and fibonacci I've found that 4.236 often times bring about the top on a parabolic move. So by following that logic I would put the top, at least a local one, at $3,800. Roughly 25% from here. Anyways, that's my 2 cents on Gold. Happy trading.
Don't force a trade. Wait for your setup, be patient. Trade ideas are my own and not financial advice, I'm a monkey with a phone for crying out loud.
Disclaimer
The information and publications are not meant to be, and do not constitute, financial, investment, trading, or other types of advice or recommendations supplied or endorsed by TradingView. Read more in the Terms of Use.