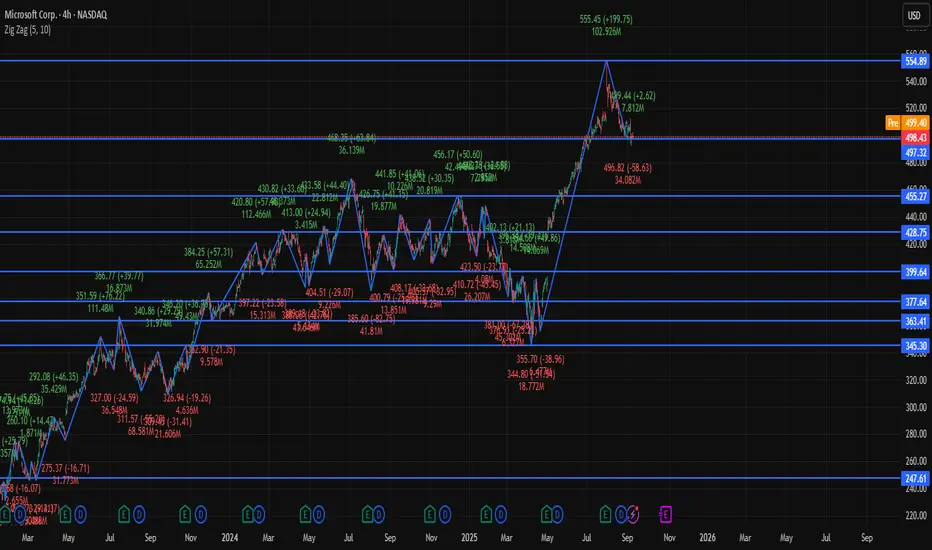
MSFT Snapshot (as of latest session)
Current Price: Around $498.40
Day Range: $497.0 – $502.2
Open: ~$501.4
Market Cap: ~$2.79 Trillion
P/E Ratio: ~28.9
EPS: ~12.93
Pivot Levels (Daily basis, useful for 4-Hour analysis)
Pivot Point: ~$498.9
Resistance Levels:
R1: ~$499.5
R2: ~$500.0
R3: ~$500.6
Support Levels:
S1: ~$498.4
S2: ~$497.8
S3: ~$497.3
Technical View (4-Hour Frame)
Momentum: Price is consolidating near the pivot (~$498–499).
Indicators:
RSI around 45 → neutral to slightly bearish.
MACD negative → bearish bias.
Moving Averages (short and long) → leaning bearish.
Bias:
A breakout above $500 may open short-term upside toward ~$500.6 or higher.
If MSFT falls below $498, pullback risk increases toward $497.8 → $497.3.
✅ Conclusion: On the 4-hour timeframe, MSFT is in a neutral-to-bearish phase, stuck around its pivot. Buyers need a clear move above $500 to regain strength; otherwise, it risks drifting lower toward support.
Disclaimer
The information and publications are not meant to be, and do not constitute, financial, investment, trading, or other types of advice or recommendations supplied or endorsed by TradingView. Read more in the Terms of Use.
Disclaimer
The information and publications are not meant to be, and do not constitute, financial, investment, trading, or other types of advice or recommendations supplied or endorsed by TradingView. Read more in the Terms of Use.