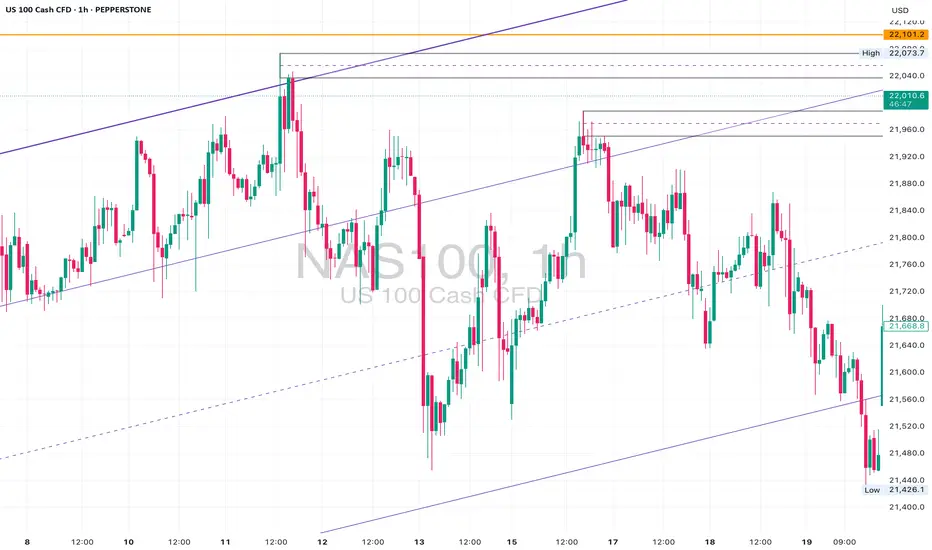
📍 Levels Marked: 22,101 Resistance | 21,880 Mid-Level | 21,375 Channel Support
⸻
📊 Technical Breakdown:
The NAS100 has surged into the 22,000+ range, breaking above the mid-level channel boundary after consolidating beneath it for days. This breakout takes us right back into an untested supply zone from March.
On the lower timeframes (1H & 23min), price cleanly cleared multiple lower highs with aggressive bullish momentum, printing a new intraday high at 22,015. However, structure is still trapped inside a long-term ascending channel on the 4H and D1 — and this move could be setting up a liquidity grab before reversal.
Key zone to watch:
• 22,101 – 22,200 (daily resistance + equal highs)
• 21,880 – 21,920 (possible retest zone)
• 21,375 (channel base support)
⸻
📉 Trade Ideas:
• Short Bias if price rejects the 22,100–22,200 area with bearish confirmation on lower timeframes. Target: 21,800 – 21,600.
• Long Bias only if price gives a bullish retest of the 21,880–21,920 zone with clean structure. Target: 22,222+ with tight risk.
⸻
💡 Final Thoughts:
A textbook case of a channel edge breakout — but breakout or fakeout? Always wait for confirmation and let structure guide the setup. We’re either about to print new highs or see a sharp correction.
📌 Mark your levels. Watch the retest. Execute with confidence.
⸻
📊 Technical Breakdown:
The NAS100 has surged into the 22,000+ range, breaking above the mid-level channel boundary after consolidating beneath it for days. This breakout takes us right back into an untested supply zone from March.
On the lower timeframes (1H & 23min), price cleanly cleared multiple lower highs with aggressive bullish momentum, printing a new intraday high at 22,015. However, structure is still trapped inside a long-term ascending channel on the 4H and D1 — and this move could be setting up a liquidity grab before reversal.
Key zone to watch:
• 22,101 – 22,200 (daily resistance + equal highs)
• 21,880 – 21,920 (possible retest zone)
• 21,375 (channel base support)
⸻
📉 Trade Ideas:
• Short Bias if price rejects the 22,100–22,200 area with bearish confirmation on lower timeframes. Target: 21,800 – 21,600.
• Long Bias only if price gives a bullish retest of the 21,880–21,920 zone with clean structure. Target: 22,222+ with tight risk.
⸻
💡 Final Thoughts:
A textbook case of a channel edge breakout — but breakout or fakeout? Always wait for confirmation and let structure guide the setup. We’re either about to print new highs or see a sharp correction.
📌 Mark your levels. Watch the retest. Execute with confidence.
Disclaimer
The information and publications are not meant to be, and do not constitute, financial, investment, trading, or other types of advice or recommendations supplied or endorsed by TradingView. Read more in the Terms of Use.
Disclaimer
The information and publications are not meant to be, and do not constitute, financial, investment, trading, or other types of advice or recommendations supplied or endorsed by TradingView. Read more in the Terms of Use.