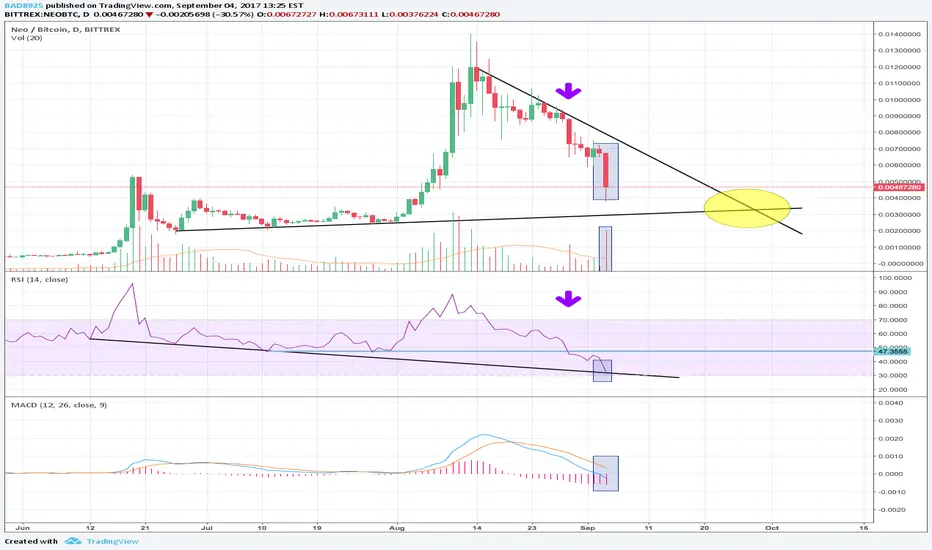
Price action, volume, RSI, and MACD all indicate the massive sell off we just witnessed. Making a wedge with the support and resistance lines, I speculate that later September, the price will be at a good entry point as indicated by the yellow ellipse. The blue line on the RSI also seems to be of significance. Not sure at the moment what that line is telling me, but we will find out in the near future.
Note
The blue line was a support line until it broke down. Now it is acting as a resistance line.Disclaimer
The information and publications are not meant to be, and do not constitute, financial, investment, trading, or other types of advice or recommendations supplied or endorsed by TradingView. Read more in the Terms of Use.
Disclaimer
The information and publications are not meant to be, and do not constitute, financial, investment, trading, or other types of advice or recommendations supplied or endorsed by TradingView. Read more in the Terms of Use.