Long-Term (Monthly/Weekly) - SWING PERSPECTIVE
Trend & Structure:
Elliott Wave:
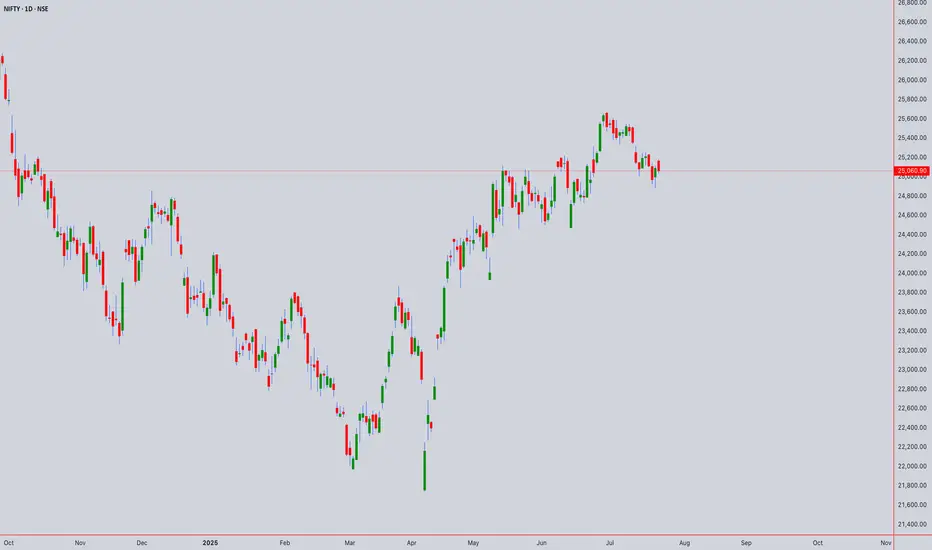
Primary Trend: Bullish (Wave 3 or 5 ongoing since 2023).
Current Phase: Likely final sub-wave (Wave 5) targeting ₹25,800–26,200.
Risk: Completion of Wave 5 may trigger a 10–15% correction (ABC pattern) toward ₹22,500–23,000 (38.2% Fib retracement).
Wyckoff & Volume:
Accumulation/Distribution: Monthly volume declining near highs → early distribution signals.
Key Level: Close below ₹24,800 confirms distribution phase (bearish reversal).
Gann Analysis (Price-Time Squaring):
Square of 9:
Key Resistance: ₹25,317 (√25,060 ≈ 158.3; 158.5² = 25,132 → 159² = 25,281).
Major Support: ₹24,649 (157.5²), ₹24,000 (psychological + Gann 45° angle).
Time Cycle:
Aug-Sep 2025 critical for reversal (90-day cycle from April 2025 high).
Ichimoku (Weekly):
Kumo Cloud: Price above cloud → bullish bias.
Lagging Span (Chikou): Above price (26 weeks back) → no congestion.
Warning: Tenkan (9) below Kijun (26) on weekly → momentum loss.
Moving Averages (Weekly):
Bullish Stacking: EMA(20) > EMA(50) > SMA(100) → trend intact.
Support: EMA(20) at ₹24,200
Medium-Term (Daily/4H) - SWING ENTRY
Candlestick Patterns:
Daily: Doji/Spinning Top near ₹25,060 → indecision.
4H: Bearish Shooting Star → resistance at ₹25,150–25,200.
Harmonic Patterns:
Bullish Bat potential (PRZ: ₹24,600–24,750).
Bearish Crab if price rejects ₹25,300 (PRZ: ₹25,280–25,350).
Gann Angles:
1x1 Angle Support (from June 2025 low): ₹24,900 (break → accelerates selling).
Price-Time Squaring:
24th July = 180° from Jan 2025 low → watch for volatility.
RSI + Bollinger Bands (Daily):
RSI(14): 68 (neutral-bearish divergence → weakening momentum).
BB(20,2): Price near upper band (₹25,200) → overbought.
VWAP (4H): Price above VWAP → intraday bullish, but divergence at highs.
Intraday (1H/30M/15M/5M)
Ichimoku (1H):
Tenkan (9) > Kijun (26): Bullish.
Kumo Twist: Support at ₹24,950 (cloud top).
Sell Signal: If price breaks below Kijun (₹25,010).
Moving Averages (30M):
EMA(20): ₹25,040 (intraday support).
Death Cross: EMA(20) < SMA(50) on 15M → short-term bearish.
RSI + BB (15M):
RSI(14): 72 → overbought.
BB Squeeze: Bands narrowing → expect breakout (bearish bias below VWAP).
Gann Intraday Levels (5M):
Resistance: ₹25,100 (1x1 angle), ₹25,180 (2x1).
Support: ₹24,980 (1x1 downside), ₹24,920 (2x1).
Synthesis & Trading Plan
Bullish Scenario (Swing):
Trigger: Hold above ₹24,900 (Gann 1x1) + RSI > 60 on weekly.
Target: ₹25,800–26,200 (Wave 5, Gann Square 159²).
Stop Loss: ₹24,650 (Harmonic Bat PRZ).
Bearish Reversal (Intraday/Swing):
Trigger: Close below ₹24,950 (Ichimoku cloud) + RSI < 50.
Target: ₹24,600 (Harmonic Bat), ₹24,000 (monthly SMA).
Stop Loss: ₹25,200 (Bollinger upper band).
Intraday Levels (23rd July):
Resistance Support
₹25,100 (1H VWAP) ₹25,000 (psych)
₹25,180 (Gann 2x1) ₹24,950 (Ichimoku)
₹25,280 (Sq9) ₹24,800 (daily pivot)
Key Risk Factors
Gann Time Cycle: 24–28 July = high volatility (price-time square).
Elliott Terminal Wave: Wave 5 exhaustion → strict stop losses.
VWAP Divergence: Failure to hold above VWAP on 4H → short.
Instrument: NIFTY50
Strategy:
Swing: Wait for daily close above ₹25,150 (confirms bullish) or below ₹24,800 (bearish).
Intraday: Sell rallies to ₹25,100–25,150 (RSI>70, BB squeeze) for ₹24,950.
Verified Tools:
Gann Square of 9 + Ichimoku for precision entries.
RSI/BB for overbought/oversold filters.
For those interested in further developing their trading skills based on these types of analyses, consider exploring the mentoring program offered by Shunya Trade.(world wide web shunya trade)
I welcome your feedback on this analysis, as it will inform and enhance my future work.
Regards,
Shunya Trade
world wide web shunya trade
⚠️ Disclaimer: This post is educational content and does not constitute investment advice, financial advice, or trading recommendations. The views expressed here are based on technical analysis and are shared solely for informational purposes. The stock market is subject to risks, including capital loss, and readers should exercise due diligence before investing. We do not take responsibility for decisions made based on this content. Consult a certified financial advisor for personalized guidance.
Trend & Structure:
Elliott Wave:
Primary Trend: Bullish (Wave 3 or 5 ongoing since 2023).
Current Phase: Likely final sub-wave (Wave 5) targeting ₹25,800–26,200.
Risk: Completion of Wave 5 may trigger a 10–15% correction (ABC pattern) toward ₹22,500–23,000 (38.2% Fib retracement).
Wyckoff & Volume:
Accumulation/Distribution: Monthly volume declining near highs → early distribution signals.
Key Level: Close below ₹24,800 confirms distribution phase (bearish reversal).
Gann Analysis (Price-Time Squaring):
Square of 9:
Key Resistance: ₹25,317 (√25,060 ≈ 158.3; 158.5² = 25,132 → 159² = 25,281).
Major Support: ₹24,649 (157.5²), ₹24,000 (psychological + Gann 45° angle).
Time Cycle:
Aug-Sep 2025 critical for reversal (90-day cycle from April 2025 high).
Ichimoku (Weekly):
Kumo Cloud: Price above cloud → bullish bias.
Lagging Span (Chikou): Above price (26 weeks back) → no congestion.
Warning: Tenkan (9) below Kijun (26) on weekly → momentum loss.
Moving Averages (Weekly):
Bullish Stacking: EMA(20) > EMA(50) > SMA(100) → trend intact.
Support: EMA(20) at ₹24,200
Medium-Term (Daily/4H) - SWING ENTRY
Candlestick Patterns:
Daily: Doji/Spinning Top near ₹25,060 → indecision.
4H: Bearish Shooting Star → resistance at ₹25,150–25,200.
Harmonic Patterns:
Bullish Bat potential (PRZ: ₹24,600–24,750).
Bearish Crab if price rejects ₹25,300 (PRZ: ₹25,280–25,350).
Gann Angles:
1x1 Angle Support (from June 2025 low): ₹24,900 (break → accelerates selling).
Price-Time Squaring:
24th July = 180° from Jan 2025 low → watch for volatility.
RSI + Bollinger Bands (Daily):
RSI(14): 68 (neutral-bearish divergence → weakening momentum).
BB(20,2): Price near upper band (₹25,200) → overbought.
VWAP (4H): Price above VWAP → intraday bullish, but divergence at highs.
Intraday (1H/30M/15M/5M)
Ichimoku (1H):
Tenkan (9) > Kijun (26): Bullish.
Kumo Twist: Support at ₹24,950 (cloud top).
Sell Signal: If price breaks below Kijun (₹25,010).
Moving Averages (30M):
EMA(20): ₹25,040 (intraday support).
Death Cross: EMA(20) < SMA(50) on 15M → short-term bearish.
RSI + BB (15M):
RSI(14): 72 → overbought.
BB Squeeze: Bands narrowing → expect breakout (bearish bias below VWAP).
Gann Intraday Levels (5M):
Resistance: ₹25,100 (1x1 angle), ₹25,180 (2x1).
Support: ₹24,980 (1x1 downside), ₹24,920 (2x1).
Synthesis & Trading Plan
Bullish Scenario (Swing):
Trigger: Hold above ₹24,900 (Gann 1x1) + RSI > 60 on weekly.
Target: ₹25,800–26,200 (Wave 5, Gann Square 159²).
Stop Loss: ₹24,650 (Harmonic Bat PRZ).
Bearish Reversal (Intraday/Swing):
Trigger: Close below ₹24,950 (Ichimoku cloud) + RSI < 50.
Target: ₹24,600 (Harmonic Bat), ₹24,000 (monthly SMA).
Stop Loss: ₹25,200 (Bollinger upper band).
Intraday Levels (23rd July):
Resistance Support
₹25,100 (1H VWAP) ₹25,000 (psych)
₹25,180 (Gann 2x1) ₹24,950 (Ichimoku)
₹25,280 (Sq9) ₹24,800 (daily pivot)
Key Risk Factors
Gann Time Cycle: 24–28 July = high volatility (price-time square).
Elliott Terminal Wave: Wave 5 exhaustion → strict stop losses.
VWAP Divergence: Failure to hold above VWAP on 4H → short.
Instrument: NIFTY50
Strategy:
Swing: Wait for daily close above ₹25,150 (confirms bullish) or below ₹24,800 (bearish).
Intraday: Sell rallies to ₹25,100–25,150 (RSI>70, BB squeeze) for ₹24,950.
Verified Tools:
Gann Square of 9 + Ichimoku for precision entries.
RSI/BB for overbought/oversold filters.
For those interested in further developing their trading skills based on these types of analyses, consider exploring the mentoring program offered by Shunya Trade.(world wide web shunya trade)
I welcome your feedback on this analysis, as it will inform and enhance my future work.
Regards,
Shunya Trade
world wide web shunya trade
⚠️ Disclaimer: This post is educational content and does not constitute investment advice, financial advice, or trading recommendations. The views expressed here are based on technical analysis and are shared solely for informational purposes. The stock market is subject to risks, including capital loss, and readers should exercise due diligence before investing. We do not take responsibility for decisions made based on this content. Consult a certified financial advisor for personalized guidance.
Disclaimer
The information and publications are not meant to be, and do not constitute, financial, investment, trading, or other types of advice or recommendations supplied or endorsed by TradingView. Read more in the Terms of Use.
Disclaimer
The information and publications are not meant to be, and do not constitute, financial, investment, trading, or other types of advice or recommendations supplied or endorsed by TradingView. Read more in the Terms of Use.