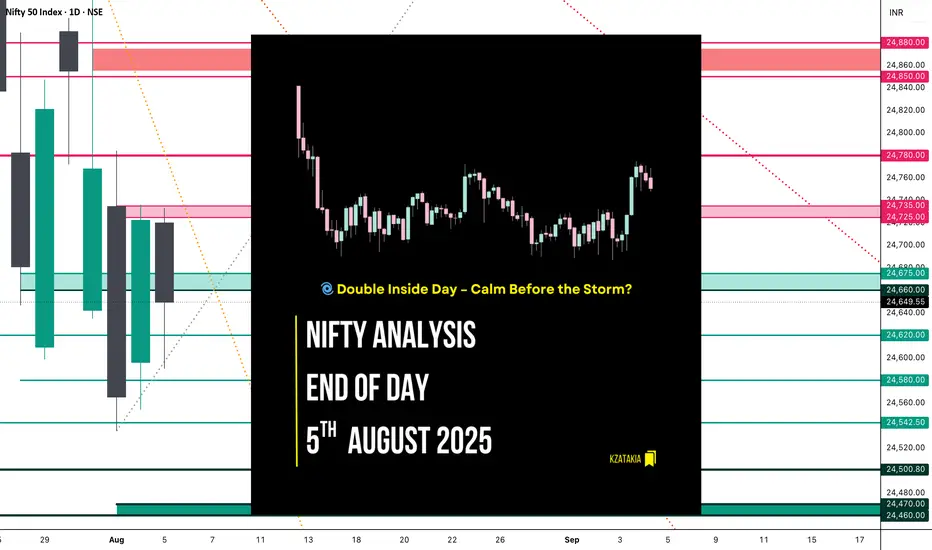
🟢 Nifty Analysis EOD – August 5, 2025 – Tuesday 🔴
🌀 Double Inside Day – Calm Before the Storm?
📊 Nifty Summary
In the wind of negative news, yet Nifty starts neutral at the resistance zone of 24,725 ~ 24,735 but was unable to hold there and fell 140 points within the first 45 minutes.
After this initial sell-off, Nifty found support around 24,590, which coincided with yesterday's Fib 0.786 level, R1, and Previous Week Low (PWL).
These levels were well-defended throughout the session. Near the end, the index recovered ~80 points and closed at 24,649.55, close to yesterday’s Fib 0.5.
Can we consider today's move a retracement or a pullback of yesterday's move?
Same as Monday, today’s action stayed inside the previous session’s range, forming an Inside Bar. Now it appears as a Double Inside Bar on the daily chart.
📉 5 Min Time Frame Chart with Intraday Levels

📉 Daily Time Frame Chart with Intraday Levels

🕯 Daily Candle Breakdown
Candle Structure Breakdown:
🔴 Red Candle (Close < Open):
24,720.25 − 24,649.55 = 70.70 points
🔼 Upper Wick:
24,733.10 − 24,720.25 = 12.85 points
🔽 Lower Wick:
24,649.55 − 24,590.30 = 59.25 points
Interpretation:
After a flat open, the index tried to move higher but faced resistance near 24,730, then reversed.
Buying interest was seen near the 24,590 zone, but sellers remained in control.
It closed below the open with a decent lower wick, indicating some buying support but overall weakness.
Candle Type:
🕯 A pullback candle with a moderate real body and long lower wick – suggests buyers attempted to support the fall, but sellers dominated.
🛡 5 Min Intraday Chart

⚔️ Gladiator Strategy Update
ATR: 202.71
IB Range: 139.95 → 🟠 Medium
Market Structure: Balanced
Trade Summary:
❌ No entry triggered by system
📌 Support & Resistance Levels
🔼 Resistance Zones:
🔽 Support Zones:
🧠 Final Thoughts
Today's double inside bar structure signals contraction and indecision — markets are waiting for a decisive breakout.
“The tighter the coil, the bigger the breakout.”
Keep an eye on these tight ranges. Patience before power!
✏️ Disclaimer
This is just my personal viewpoint. Always consult your financial advisor before taking any action.
🌀 Double Inside Day – Calm Before the Storm?
📊 Nifty Summary
In the wind of negative news, yet Nifty starts neutral at the resistance zone of 24,725 ~ 24,735 but was unable to hold there and fell 140 points within the first 45 minutes.
After this initial sell-off, Nifty found support around 24,590, which coincided with yesterday's Fib 0.786 level, R1, and Previous Week Low (PWL).
These levels were well-defended throughout the session. Near the end, the index recovered ~80 points and closed at 24,649.55, close to yesterday’s Fib 0.5.
Can we consider today's move a retracement or a pullback of yesterday's move?
Same as Monday, today’s action stayed inside the previous session’s range, forming an Inside Bar. Now it appears as a Double Inside Bar on the daily chart.
📉 5 Min Time Frame Chart with Intraday Levels
📉 Daily Time Frame Chart with Intraday Levels
🕯 Daily Candle Breakdown
- Open: 24,720.25
- High: 24,733.10
- Low: 24,590.30
- Close: 24,649.55
- Change: −73.20 (−0.30%)
Candle Structure Breakdown:
🔴 Red Candle (Close < Open):
24,720.25 − 24,649.55 = 70.70 points
🔼 Upper Wick:
24,733.10 − 24,720.25 = 12.85 points
🔽 Lower Wick:
24,649.55 − 24,590.30 = 59.25 points
Interpretation:
After a flat open, the index tried to move higher but faced resistance near 24,730, then reversed.
Buying interest was seen near the 24,590 zone, but sellers remained in control.
It closed below the open with a decent lower wick, indicating some buying support but overall weakness.
Candle Type:
🕯 A pullback candle with a moderate real body and long lower wick – suggests buyers attempted to support the fall, but sellers dominated.
🛡 5 Min Intraday Chart
⚔️ Gladiator Strategy Update
ATR: 202.71
IB Range: 139.95 → 🟠 Medium
Market Structure: Balanced
Trade Summary:
❌ No entry triggered by system
📌 Support & Resistance Levels
🔼 Resistance Zones:
- 24,725 ~ 24,735
- 24,780 ~ 24,795
- 24,860 ~ 24,880
🔽 Support Zones:
- 24,675 ~ 24,660
- 24,620
- 24,542 ~ 24,535
- 24,500
- 24,470 ~ 24,460
🧠 Final Thoughts
Today's double inside bar structure signals contraction and indecision — markets are waiting for a decisive breakout.
“The tighter the coil, the bigger the breakout.”
Keep an eye on these tight ranges. Patience before power!
✏️ Disclaimer
This is just my personal viewpoint. Always consult your financial advisor before taking any action.
Read my blogs here:
substack.com/@kzatakia
Follow me on Telegram:
t.me/swingtraderhub
Follow me on X:
x.com/kzatakia
substack.com/@kzatakia
Follow me on Telegram:
t.me/swingtraderhub
Follow me on X:
x.com/kzatakia
Related publications
Disclaimer
The information and publications are not meant to be, and do not constitute, financial, investment, trading, or other types of advice or recommendations supplied or endorsed by TradingView. Read more in the Terms of Use.