Comprehensive Technical Analysis for NIFTY50
world wide web shunya trade
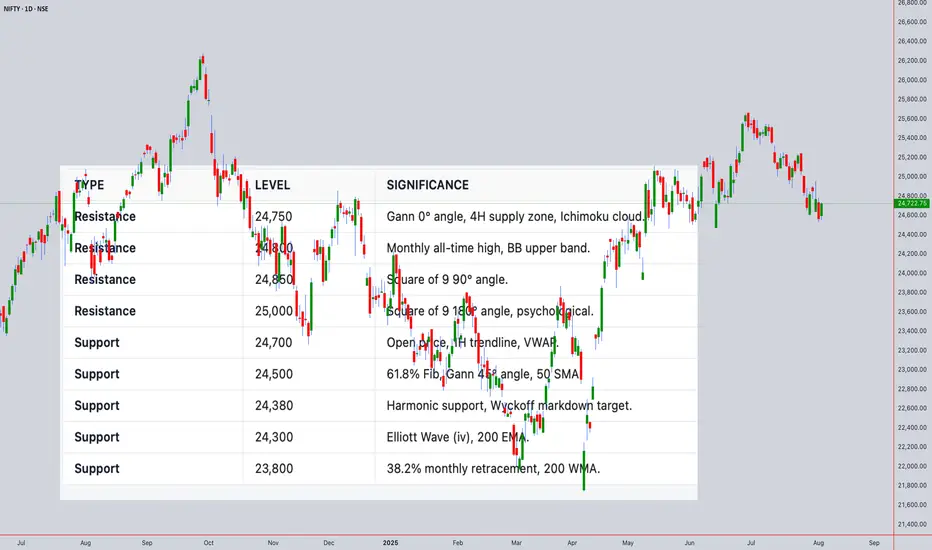
Closing Price: ₹24,722.75 (4th Aug 2025, 02:00PM UTC+4)
Time Frames:
Intraday: 5M, 15M, 30M, 1H, 4H
Swing: 4H, Daily, Weekly, Monthly
1. Japanese Candlestick Analysis
Intraday (5M-4H)
4H: Bearish Engulfing at 24,722.75 signals rejection of highs.
1H: Dark Cloud Cover below 24,750 confirms weakness.
30M/15M: Shooting Stars at 24,720 indicate exhaustion.
5M: Three Black Crows pattern suggests strong bearish momentum.
Outlook: Bearish reversal likely if 24,700 breaks.
Swing (4H-Monthly)
Daily: Gravestone Doji at 24,722.75 warns of trend exhaustion.
Weekly: Bearish Harami after 3-week rally signals distribution.
Monthly: Long-legged Doji at all-time highs (24,800) indicates indecision.
2. Harmonic Patterns
Intraday
4H/1H: Bearish Butterfly completing at 24,722.75 (D-point).
PRZ: 24,700–24,750 (127.2% XA + 161.8% BC).
30M: Bullish Crab forming at 24,600 (secondary setup).
Swing
Daily: Bearish Gartley near 24,750 (78.6% XA retracement).
Weekly: Potential Bullish Bat at 24,500 if correction extends.
3. Elliott Wave Theory
Intraday
4H: Wave 5 of impulse cycle peaked at 24,722.75.
Structure: Completed 5-wave sequence from 24,200 → 24,722.75.
Corrective Phase: ABC pullback targeting 24,500 (Wave A).
1H: Sub-wave (v) ending with RSI divergence.
Swing
Daily: Wave 3 of primary bull cycle nearing completion at 24,750.
Weekly: Wave (iii) of larger impulse, expecting Wave (iv) correction to 24,300.
Monthly: Wave V of multi-year bull run, nearing major resistance at 24,800.
4. Wyckoff Theory
Intraday
Phase: Distribution (after markup from 24,200 → 24,722.75).
Signs: High volume at 24,722.75 (supply), failed upthrust above 24,750.
Schematic: Phase C (markdown) initiating.
Swing
Daily: Late Markup → Distribution at 24,750.
Weekly: Accumulation completed at 23,500; now in Markup but showing signs of exhaustion.
5. W.D. Gann Theory
Time Theory
Intraday: Key reversal windows:
UTC+4: 10:00–12:00 (resistance test), 14:00–16:00 (trend reversal).
Swing:
Daily: 8th Aug (4 days from close) for time squaring.
Weekly: 12th Aug (1 week) for cycle turn.
Square of 9
24,722.75 → Resistance Angles:
0° (24,750), 90° (24,850), 180° (25,000).
Support: 45° (24,500), 315° (24,250).
Angle Theory
4H Chart: 1x1 Gann Angle (45°) from 24,200 low at 24,500. Price overextended.
Daily Chart: 2x1 Angle (63.75°) at 24,722.75 acting as resistance.
Squaring of Price & Time
Price Range: 24,200 → 24,722.75 (522.75 points).
Time Squaring: 522.75 hours from 24,200 low → 24,750 resistance.
Ranges in Harmony
Primary Range: 24,000–25,000 (1,000 points).
50% Retracement: 24,500 (critical support).
61.8% Retracement: 24,380.
Secondary Range: 24,500–24,750 (250 points).
Price & Time Forecasting
Intraday Targets:
Short-Term: 24,500 (61.8% Fib).
Extension: 24,380 (Gann 45° angle).
Swing Targets:
Weekly: 24,300 (Wave (iv) target).
Monthly: 23,800 (38.2% retracement of entire bull run).
6. Ichimoku Kinko Hyo
Intraday (4H)
Cloud (Kumo): Price below Kumo (bearish).
Tenkan-sen: 24,700 (flat, resistance).
Kijun-sen: 24,650 (support).
Chikou Span: Below price (confirms bearish momentum).
Swing (Daily)
Cloud: Thick cloud resistance at 24,750–24,800.
Tenkan/Kijun: Bearish crossover at 24,700.
7. Indicators
Intraday
RSI (14): 68 (4H) → Overbought; divergence at highs.
Bollinger Bands: Price tagging upper band (24,750); contraction signals volatility.
VWAP: 24,680 (acting as dynamic resistance).
Moving Averages:
50 SMA: 24,600 (support).
200 EMA: 24,400 (major support).
Swing
Daily RSI: 72 (overbought, divergence).
Weekly BB: Upper band at 24,800 (resistance).
Monthly VWAP: 23,500 (major support).
200 WMA: 22,800 (long-term bull support).
Synthesized Forecast
Intraday (Next 24H)
Bearish Scenario (High Probability):
Trigger: Break below 24,700 (1H close).
Targets: 24,500 (T1), 24,380 (T2).
Timeline: 8–12 hours (UTC+4 22:00–02:00).
Bullish Scenario (Low Probability):
Trigger: Sustained close above 24,750.
Target: 24,850 (Gann 90° angle).
Swing (1–4 Weeks)
Bearish Scenario:
Targets: 24,300 (Wave (iv)), 23,800 (38.2% retracement).
Timeline: 5–10 trading days.
Bullish Scenario:
Trigger: Close above 24,800.
Target: 25,200 (Gann 180° angle).
For those interested in further developing their trading skills based on these types of analyses, consider exploring the mentoring program offered by Shunya Trade.(world wide web shunya trade)
I welcome your feedback on this analysis, as it will inform and enhance my future work.
Regards,
Shunya.Trade
world wide web shunya trade
⚠️ Disclaimer: This post is educational content and does not constitute investment advice, financial advice, or trading recommendations. The views expressed here are based on technical analysis and are shared solely for informational purposes. The stock market is subject to risks, including capital loss, and readers should exercise due diligence before investing. We do not take responsibility for decisions made based on this content. Consult a certified financial advisor for personalized guidance.
world wide web shunya trade
Closing Price: ₹24,722.75 (4th Aug 2025, 02:00PM UTC+4)
Time Frames:
Intraday: 5M, 15M, 30M, 1H, 4H
Swing: 4H, Daily, Weekly, Monthly
1. Japanese Candlestick Analysis
Intraday (5M-4H)
4H: Bearish Engulfing at 24,722.75 signals rejection of highs.
1H: Dark Cloud Cover below 24,750 confirms weakness.
30M/15M: Shooting Stars at 24,720 indicate exhaustion.
5M: Three Black Crows pattern suggests strong bearish momentum.
Outlook: Bearish reversal likely if 24,700 breaks.
Swing (4H-Monthly)
Daily: Gravestone Doji at 24,722.75 warns of trend exhaustion.
Weekly: Bearish Harami after 3-week rally signals distribution.
Monthly: Long-legged Doji at all-time highs (24,800) indicates indecision.
2. Harmonic Patterns
Intraday
4H/1H: Bearish Butterfly completing at 24,722.75 (D-point).
PRZ: 24,700–24,750 (127.2% XA + 161.8% BC).
30M: Bullish Crab forming at 24,600 (secondary setup).
Swing
Daily: Bearish Gartley near 24,750 (78.6% XA retracement).
Weekly: Potential Bullish Bat at 24,500 if correction extends.
3. Elliott Wave Theory
Intraday
4H: Wave 5 of impulse cycle peaked at 24,722.75.
Structure: Completed 5-wave sequence from 24,200 → 24,722.75.
Corrective Phase: ABC pullback targeting 24,500 (Wave A).
1H: Sub-wave (v) ending with RSI divergence.
Swing
Daily: Wave 3 of primary bull cycle nearing completion at 24,750.
Weekly: Wave (iii) of larger impulse, expecting Wave (iv) correction to 24,300.
Monthly: Wave V of multi-year bull run, nearing major resistance at 24,800.
4. Wyckoff Theory
Intraday
Phase: Distribution (after markup from 24,200 → 24,722.75).
Signs: High volume at 24,722.75 (supply), failed upthrust above 24,750.
Schematic: Phase C (markdown) initiating.
Swing
Daily: Late Markup → Distribution at 24,750.
Weekly: Accumulation completed at 23,500; now in Markup but showing signs of exhaustion.
5. W.D. Gann Theory
Time Theory
Intraday: Key reversal windows:
UTC+4: 10:00–12:00 (resistance test), 14:00–16:00 (trend reversal).
Swing:
Daily: 8th Aug (4 days from close) for time squaring.
Weekly: 12th Aug (1 week) for cycle turn.
Square of 9
24,722.75 → Resistance Angles:
0° (24,750), 90° (24,850), 180° (25,000).
Support: 45° (24,500), 315° (24,250).
Angle Theory
4H Chart: 1x1 Gann Angle (45°) from 24,200 low at 24,500. Price overextended.
Daily Chart: 2x1 Angle (63.75°) at 24,722.75 acting as resistance.
Squaring of Price & Time
Price Range: 24,200 → 24,722.75 (522.75 points).
Time Squaring: 522.75 hours from 24,200 low → 24,750 resistance.
Ranges in Harmony
Primary Range: 24,000–25,000 (1,000 points).
50% Retracement: 24,500 (critical support).
61.8% Retracement: 24,380.
Secondary Range: 24,500–24,750 (250 points).
Price & Time Forecasting
Intraday Targets:
Short-Term: 24,500 (61.8% Fib).
Extension: 24,380 (Gann 45° angle).
Swing Targets:
Weekly: 24,300 (Wave (iv) target).
Monthly: 23,800 (38.2% retracement of entire bull run).
6. Ichimoku Kinko Hyo
Intraday (4H)
Cloud (Kumo): Price below Kumo (bearish).
Tenkan-sen: 24,700 (flat, resistance).
Kijun-sen: 24,650 (support).
Chikou Span: Below price (confirms bearish momentum).
Swing (Daily)
Cloud: Thick cloud resistance at 24,750–24,800.
Tenkan/Kijun: Bearish crossover at 24,700.
7. Indicators
Intraday
RSI (14): 68 (4H) → Overbought; divergence at highs.
Bollinger Bands: Price tagging upper band (24,750); contraction signals volatility.
VWAP: 24,680 (acting as dynamic resistance).
Moving Averages:
50 SMA: 24,600 (support).
200 EMA: 24,400 (major support).
Swing
Daily RSI: 72 (overbought, divergence).
Weekly BB: Upper band at 24,800 (resistance).
Monthly VWAP: 23,500 (major support).
200 WMA: 22,800 (long-term bull support).
Synthesized Forecast
Intraday (Next 24H)
Bearish Scenario (High Probability):
Trigger: Break below 24,700 (1H close).
Targets: 24,500 (T1), 24,380 (T2).
Timeline: 8–12 hours (UTC+4 22:00–02:00).
Bullish Scenario (Low Probability):
Trigger: Sustained close above 24,750.
Target: 24,850 (Gann 90° angle).
Swing (1–4 Weeks)
Bearish Scenario:
Targets: 24,300 (Wave (iv)), 23,800 (38.2% retracement).
Timeline: 5–10 trading days.
Bullish Scenario:
Trigger: Close above 24,800.
Target: 25,200 (Gann 180° angle).
For those interested in further developing their trading skills based on these types of analyses, consider exploring the mentoring program offered by Shunya Trade.(world wide web shunya trade)
I welcome your feedback on this analysis, as it will inform and enhance my future work.
Regards,
Shunya.Trade
world wide web shunya trade
⚠️ Disclaimer: This post is educational content and does not constitute investment advice, financial advice, or trading recommendations. The views expressed here are based on technical analysis and are shared solely for informational purposes. The stock market is subject to risks, including capital loss, and readers should exercise due diligence before investing. We do not take responsibility for decisions made based on this content. Consult a certified financial advisor for personalized guidance.
Disclaimer
The information and publications are not meant to be, and do not constitute, financial, investment, trading, or other types of advice or recommendations supplied or endorsed by TradingView. Read more in the Terms of Use.
Disclaimer
The information and publications are not meant to be, and do not constitute, financial, investment, trading, or other types of advice or recommendations supplied or endorsed by TradingView. Read more in the Terms of Use.