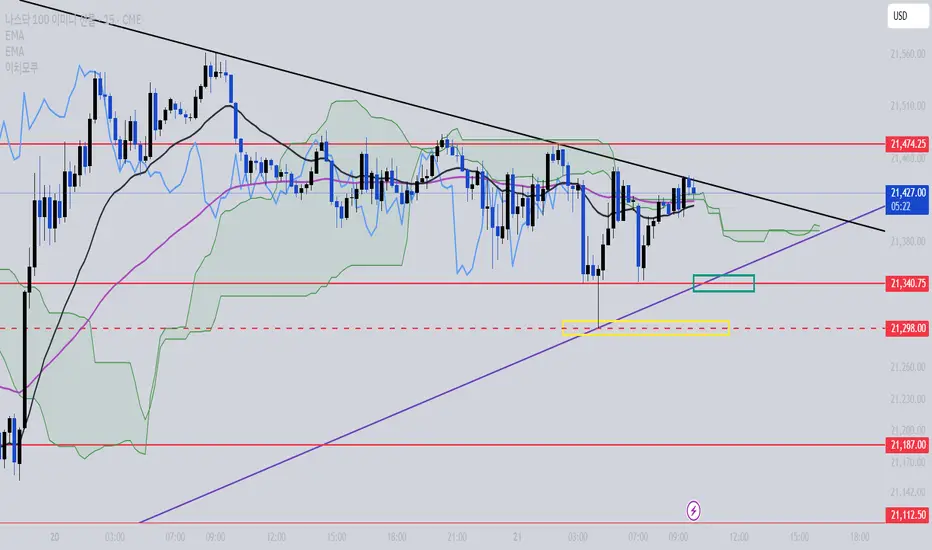
This is the current NASDAQ range.
It appears to be attempting an upward move after breaking above the short-term resistance trendline.
Since the current price has broken through a resistance level, if it surpasses the previous inflection point at 21452, it is expected to rise smoothly up to 21475.
Even if 21475 is broken, I recommend taking profits around that level because it’s a zone that has acted as resistance about four times.
It could pretend to break upward only to drop back again, so a short-term profit-taking strategy is advised.
Now, from a bearish perspective:
If the upward trendline is broken, there’s a high probability of a downward move to around 21340.
If this break occurs, the previous rebound zone at 21300 would act as a short-term support.
Should the price break below 21300, a move down to 21187 is likely.
Since the market hasn't yet chosen a clear direction, it’s risky to hold positions long-term based on a guess that a major reversal is underway.
Conclusion:
Whether buying or selling, go for short-term trades for now.
Related publications
Disclaimer
The information and publications are not meant to be, and do not constitute, financial, investment, trading, or other types of advice or recommendations supplied or endorsed by TradingView. Read more in the Terms of Use.
Related publications
Disclaimer
The information and publications are not meant to be, and do not constitute, financial, investment, trading, or other types of advice or recommendations supplied or endorsed by TradingView. Read more in the Terms of Use.