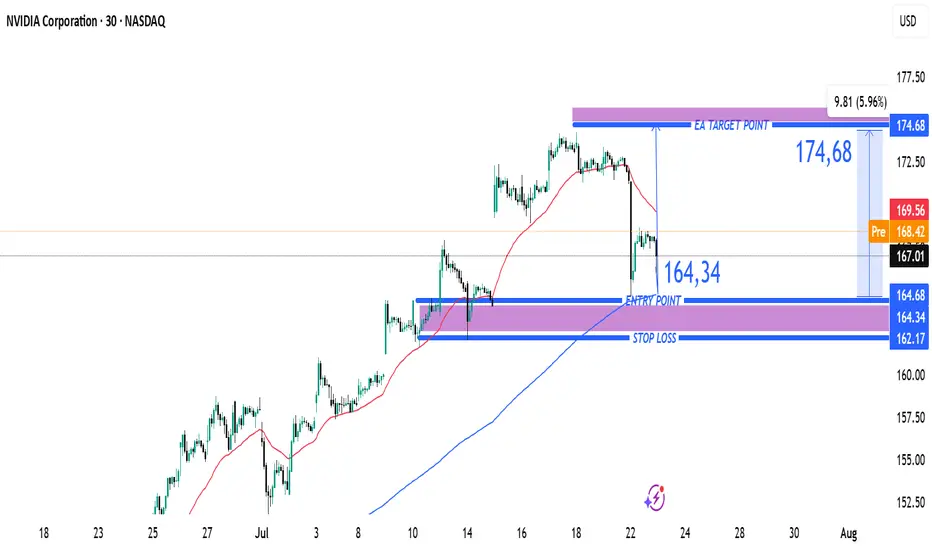
NVIDIA Corporation (NVDA) 30-Min Chart Analysis – July 23, 2025
Current Price: $167.01
Timeframe: 30-Minute
Trend Setup: Bullish Bounce from Support Zone
🔍 Key Trading Levels:
Entry Point: $164.34
Price recently bounced from this zone, suggesting support and potential for long positions.
Stop Loss: $162.17
Positioned below the purple demand zone to manage risk in case of breakdown.
Target Point (TP): $174.68
Previous resistance and local high; expected upside of +5.96% from entry.
📊 Indicator Context:
50 EMA (Red): Price currently testing below it, showing short-term correction.
200 EMA (Blue): Acting as dynamic support, aligning with the entry zone—strong technical confluence.
📈 Trade Insight:
Bias: Bullish on confirmation
Risk: ~2.17 points
Reward: ~10.34 points
Risk-to-Reward Ratio: ~4.7 (strongly favorable)
✅ Setup Strategy:
Wait for a bullish candle close above $165 for confirmation.
Strong bounce from EMA confluence and demand zone supports upside potential.
Price above $168.50 (pre-market) could further validate upward continuation toward $174.68.
Join my telegram (COPY_TRADE)
t.me/TOP1INVEESTADMEN
Join my refrel broker link
one.exnesstrack.org/a/l1t1rf3p6v
t.me/TOP1INVEESTADMEN
Join my refrel broker link
one.exnesstrack.org/a/l1t1rf3p6v
Disclaimer
The information and publications are not meant to be, and do not constitute, financial, investment, trading, or other types of advice or recommendations supplied or endorsed by TradingView. Read more in the Terms of Use.