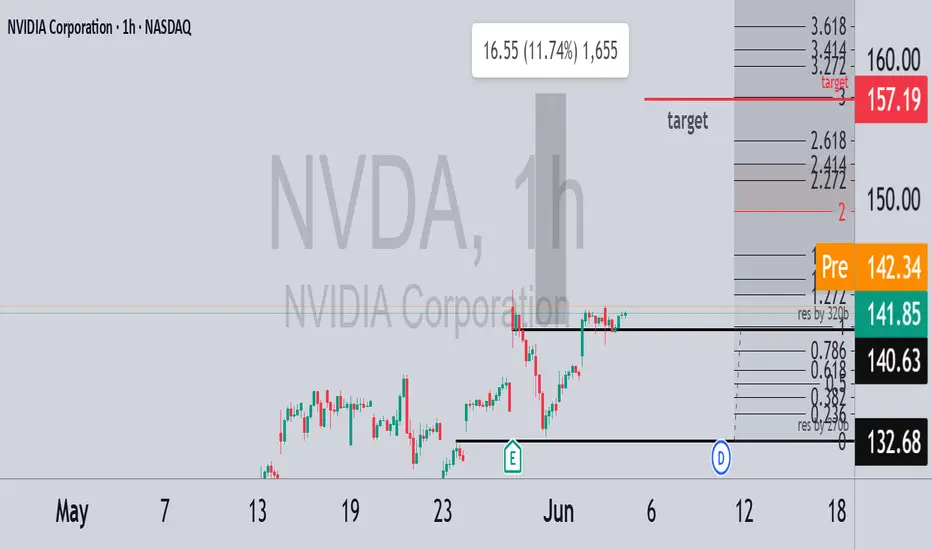
NVIDIA (NVDA) is forming a bullish continuation pattern on the 1H chart. Price action has broken above key resistance at $141.85, holding steady in pre-market at $142.31.
📈 Technical Analysis Highlights:
Fibonacci extensions show a clean breakout setup
Measured move targets $157.19 (Fib 3.0), representing +11.74% upside
Key support levels:
◾ $140.63 – recent consolidation base
◾ $132.68 – the lower trendline from May
📊 Market Cap Zones in Focus:
$270B Market Cap → corresponds to the $132–135 price area
$320B Market Cap → aligns with the $157 target zone (Fib 3.0)
These market cap levels match key price zones, adding conviction to the technical targets. A break and hold above $145 could accelerate the move toward the upper Fibonacci cluster.
Volume confirms accumulation, and price is respecting both horizontal and trendline supports.
💬 Will NVDA hit the $320B market cap before retracing????
#NVDA #NVIDIA #TechnicalAnalysis #MarketCap #Fibonacci #Breakout #NASDAQ #TechStocks #StockMarket
Disclaimer
The information and publications are not meant to be, and do not constitute, financial, investment, trading, or other types of advice or recommendations supplied or endorsed by TradingView. Read more in the Terms of Use.
Disclaimer
The information and publications are not meant to be, and do not constitute, financial, investment, trading, or other types of advice or recommendations supplied or endorsed by TradingView. Read more in the Terms of Use.