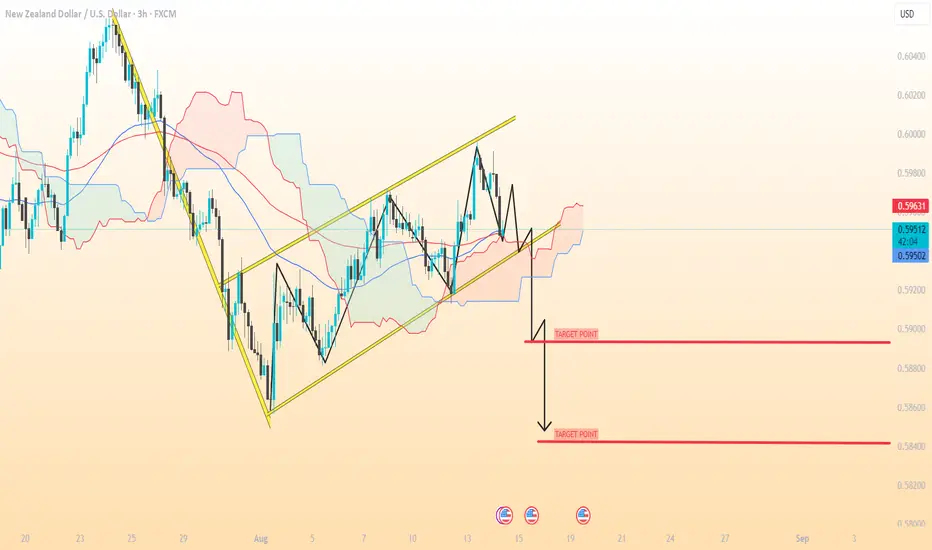
bearish flag analysis, and indicator confirmation so you can see the full picture for NZD/USD.
---
1. Pattern: Bearish Flag
Pole: From ~0.6040 down to ~0.5920 (~120 pips drop).
Flag: Upward-sloping yellow channel (counter-trend).
Break: Price has exited the channel downward — bearish continuation signal.
Target Calculation (Measured Move):
Pole height ≈ 120 pips.
Breakdown area ≈ 0.5920.
Projected target: 0.5920 − 0.0120 = 0.5800 (roughly).
This matches closely with your second marked target (0.58415) when factoring in support zones.
---
2. Targets from Your Chart & Analysis
Short-Term Target (T1) → 0.5900
Reason: Minor support and first pause zone after breakdown.
Medium-Term Target (T2) → 0.5841
Reason: Measured move + strong historical support.
Extended Target (T3) → 0.5800
Reason: Full flagpole projection without rounding for early bounces.
---
3. Indicator Confirmation
Ichimoku Cloud
Price is below the cloud → bearish signal.
Future cloud is red & widening → momentum favors downside.
Tenkan-sen and Kijun-sen above price → resistance overhead.
Trendlines
Yellow channel = flag structure.
Break below lower trendline confirms bearish bias.
Volume
(Not visible in your screenshot — but ideally, a spike in sell volume confirms the breakout.)
Overall Bias: Strong bearish continuation toward 0.5841–0.5800 unless price re-enters the channel.
---
1. Pattern: Bearish Flag
Pole: From ~0.6040 down to ~0.5920 (~120 pips drop).
Flag: Upward-sloping yellow channel (counter-trend).
Break: Price has exited the channel downward — bearish continuation signal.
Target Calculation (Measured Move):
Pole height ≈ 120 pips.
Breakdown area ≈ 0.5920.
Projected target: 0.5920 − 0.0120 = 0.5800 (roughly).
This matches closely with your second marked target (0.58415) when factoring in support zones.
---
2. Targets from Your Chart & Analysis
Short-Term Target (T1) → 0.5900
Reason: Minor support and first pause zone after breakdown.
Medium-Term Target (T2) → 0.5841
Reason: Measured move + strong historical support.
Extended Target (T3) → 0.5800
Reason: Full flagpole projection without rounding for early bounces.
---
3. Indicator Confirmation
Ichimoku Cloud
Price is below the cloud → bearish signal.
Future cloud is red & widening → momentum favors downside.
Tenkan-sen and Kijun-sen above price → resistance overhead.
Trendlines
Yellow channel = flag structure.
Break below lower trendline confirms bearish bias.
Volume
(Not visible in your screenshot — but ideally, a spike in sell volume confirms the breakout.)
Overall Bias: Strong bearish continuation toward 0.5841–0.5800 unless price re-enters the channel.
Trade active
trade activeTrade closed: target reached
target done📲 Join telegram channel free ..
t.me/RSI_Trading_Point4
Forex, Gold & Crypto Signals with detailed analysis & get consistent results..
t.me/RSI_Trading_Point4
Gold Signal's with proper TP & SL for high profit opportunities..
t.me/RSI_Trading_Point4
Forex, Gold & Crypto Signals with detailed analysis & get consistent results..
t.me/RSI_Trading_Point4
Gold Signal's with proper TP & SL for high profit opportunities..
Related publications
Disclaimer
The information and publications are not meant to be, and do not constitute, financial, investment, trading, or other types of advice or recommendations supplied or endorsed by TradingView. Read more in the Terms of Use.
📲 Join telegram channel free ..
t.me/RSI_Trading_Point4
Forex, Gold & Crypto Signals with detailed analysis & get consistent results..
t.me/RSI_Trading_Point4
Gold Signal's with proper TP & SL for high profit opportunities..
t.me/RSI_Trading_Point4
Forex, Gold & Crypto Signals with detailed analysis & get consistent results..
t.me/RSI_Trading_Point4
Gold Signal's with proper TP & SL for high profit opportunities..
Related publications
Disclaimer
The information and publications are not meant to be, and do not constitute, financial, investment, trading, or other types of advice or recommendations supplied or endorsed by TradingView. Read more in the Terms of Use.