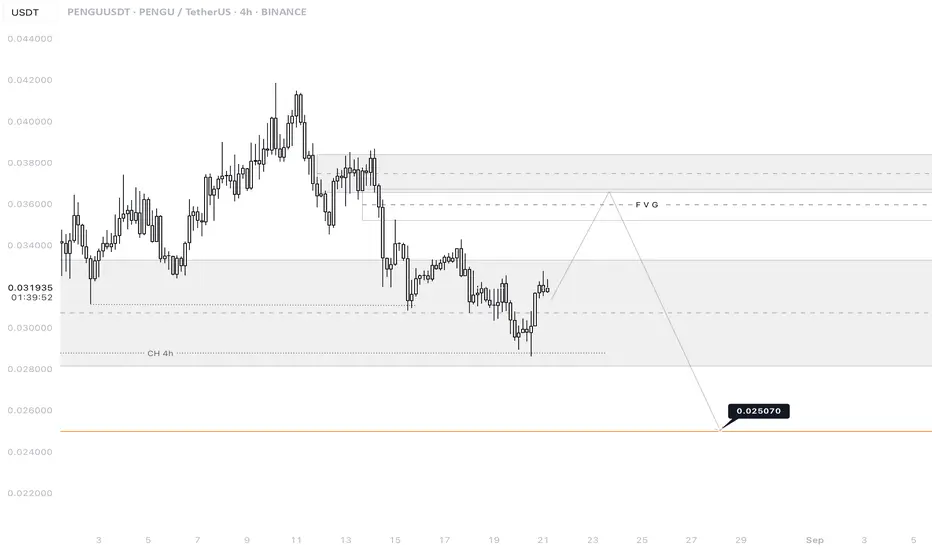
✅ PENGU/USDT — 4H (Binance) | Aug 21, 2025 — Professional Technical Analysis
🔎 Chart Context
• Pair: PENGU/USDT
• Exchange: Binance
• Timeframe: 4H
• Current price: 0.03309
• Market is in a bearish corrective phase, with lower highs since the peak at 0.041867.
• Currently rebounding from a support zone, but the dominant structure remains downward until higher levels are reclaimed.
📊 Key Observations
1. Market Structure
• High: 0.041867 (local top).
• Subsequent lower highs: 0.038684 → 0.034526 → 0.034304.
• Recent low: 0.030841.
• This confirms a clear downtrend, with rallies acting as retracements.
2. Support & Demand Zones
• 0.03117 – 0.03084: Key short-term demand block where buyers stepped in.
• 0.02850 – 0.02780 (CH 4H): Mid-term liquidity support.
• 0.02507: Long-term downside target (liquidity magnet).
3. Resistance & Supply Zones
• 0.03430 – 0.03452: Immediate resistance area.
• 0.03750 – 0.03868 (FVG zone): Strong supply + fair value gap, likely to act as rejection zone.
4. Fair Value Gap (FVG)
• Located around 0.03750 – 0.03868.
• Price may retrace into this imbalance before resuming downward move.
📈 Bullish Scenario (Corrective Rally)
• Price holds above 0.03117 – 0.03084 and pushes higher.
• Likely targets:
• TP1: 0.03430
• TP2: 0.03750 – 0.03868 (FVG fill).
• Sustained breakout only possible above 0.03868, but probability remains low in current structure.
📉 Bearish Scenario (Higher Probability)
• Price rallies into 0.03430 – 0.03868 (FVG) and faces rejection.
• Expected continuation lower toward:
• TP1: 0.03117 – 0.03084
• TP2: 0.02850 (CH 4H zone)
• Final Target: 0.02507 (major liquidity sweep).
⚡ Trading Plan
• Short Setup (Preferred):
• Entry: 0.03430 – 0.03868 (supply / FVG).
• TP1: 0.03117
• TP2: 0.02850
• TP3: 0.02507
• Stop: Above 0.03900
• Long Setup (Countertrend):
• Entry: 0.03117 – 0.03084 (support defense).
• TP: 0.03430 – 0.03750
• Stop: Below 0.03050
✅ Conclusion
PENGU/USDT is in a downtrend, but showing signs of a corrective bounce. The most probable path is a rally into 0.03750 – 0.03868 (FVG), followed by a bearish continuation targeting 0.02507 in the coming sessions. Only a break and close above 0.03868 would shift the momentum to bullish.
Disclaimer
The information and publications are not meant to be, and do not constitute, financial, investment, trading, or other types of advice or recommendations supplied or endorsed by TradingView. Read more in the Terms of Use.
Disclaimer
The information and publications are not meant to be, and do not constitute, financial, investment, trading, or other types of advice or recommendations supplied or endorsed by TradingView. Read more in the Terms of Use.