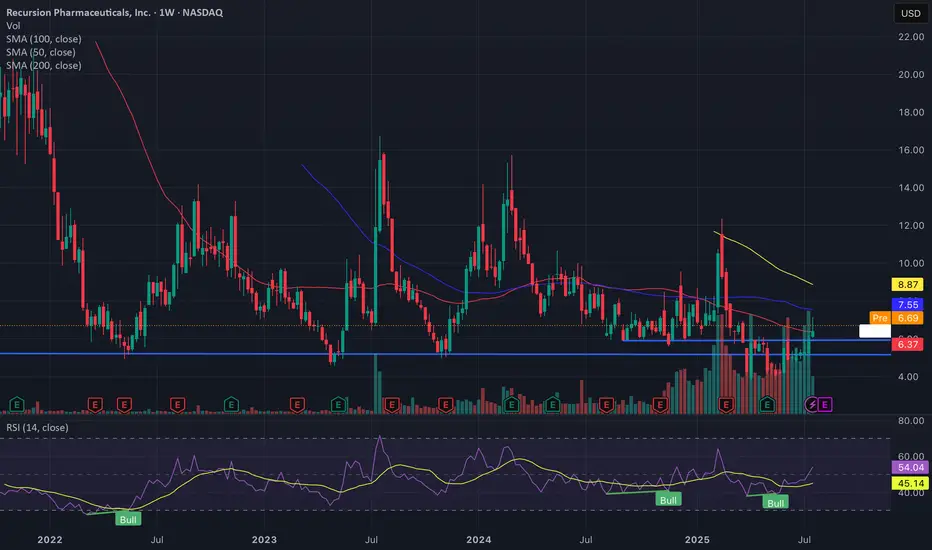
In my previous post yesterday I mentioned the multi year lower support line, the chart on that post was on a much shorter timeframe and didn’t show the support level that I talked about so I thought I’d publish this weekly chart to illustrate what I was talking about.
I also forgot to mention the large increase in the volume of shares traded over the last couple of weeks, this reflects the increase in interest in the company and is generally a positive sign when price is rising as is the case right now.
Pre market is currently indicating a strong opening up 6%, adding to yesterdays gains.
As mentioned yesterday I believe the stock will continue to advance strongly in the coming weeks and months
Disclaimer
The information and publications are not meant to be, and do not constitute, financial, investment, trading, or other types of advice or recommendations supplied or endorsed by TradingView. Read more in the Terms of Use.
Disclaimer
The information and publications are not meant to be, and do not constitute, financial, investment, trading, or other types of advice or recommendations supplied or endorsed by TradingView. Read more in the Terms of Use.