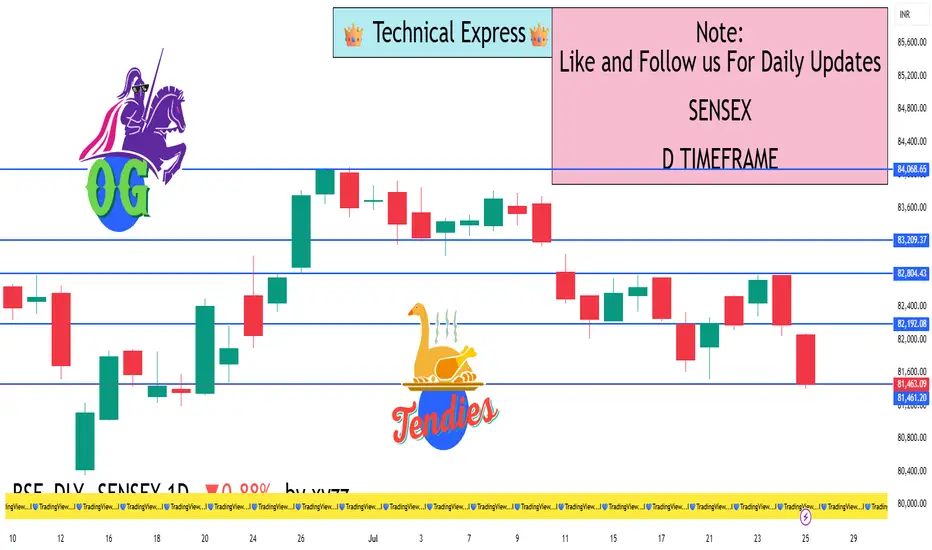
Closing Value: 81,463.09
Net Change: −721.08 points (−0.88%)
Opening Level: 82,065.76
Day’s High: 82,069.51
Day’s Low: 81,397.69
Trend: Bearish
📊 Technical Analysis:
✅ Candle Type:
Large bearish candle with a close near the day’s low.
Indicates strong selling pressure throughout the session.
🔻 Support Levels:
81,400 – Immediate support (Friday’s low)
81,000 – Critical psychological and technical level
80,700 – Medium-term support zone
🔺 Resistance Levels:
82,070 – Intraday high and near-term resistance
82,300 – Minor resistance
82,500 – Strong resistance zone
📈 Indicator Summary:
RSI (Relative Strength Index): Likely below 50 – shows weakening buying strength
MACD: Bearish crossover – confirms ongoing downtrend
Volume: Higher than average – selling was broad-based and strong
🧠 Market Sentiment:
Bearish sentiment due to pressure in Auto, Banking, Energy, and IT sectors
Major stocks pulling down the index: Reliance, HDFC Bank, Infosys, Tech Mahindra, and Bajaj Finance
Investors showed caution amid FII selling, weak global signals, and earnings season pressure
✅ Conclusion:
Sensex is in a short-term downtrend
A breakdown below 81,000 could trigger a move toward 80,700 or lower
Bulls must reclaim 82,000–82,300 levels to regain positive momentum
Hello Guys ..
WhatsApp link- wa.link/d997q0
Email - techncialexpress@gmail.com ...
Script Coder/Trader//Investor from India. Drop a comment or DM if you have any questions! Let’s grow together!
WhatsApp link- wa.link/d997q0
Email - techncialexpress@gmail.com ...
Script Coder/Trader//Investor from India. Drop a comment or DM if you have any questions! Let’s grow together!
Related publications
Disclaimer
The information and publications are not meant to be, and do not constitute, financial, investment, trading, or other types of advice or recommendations supplied or endorsed by TradingView. Read more in the Terms of Use.