My overall bias for Solana is bullish.
It has been a difficult asset to trade, however, I can still see bullish momentum is building up in higher time frames:
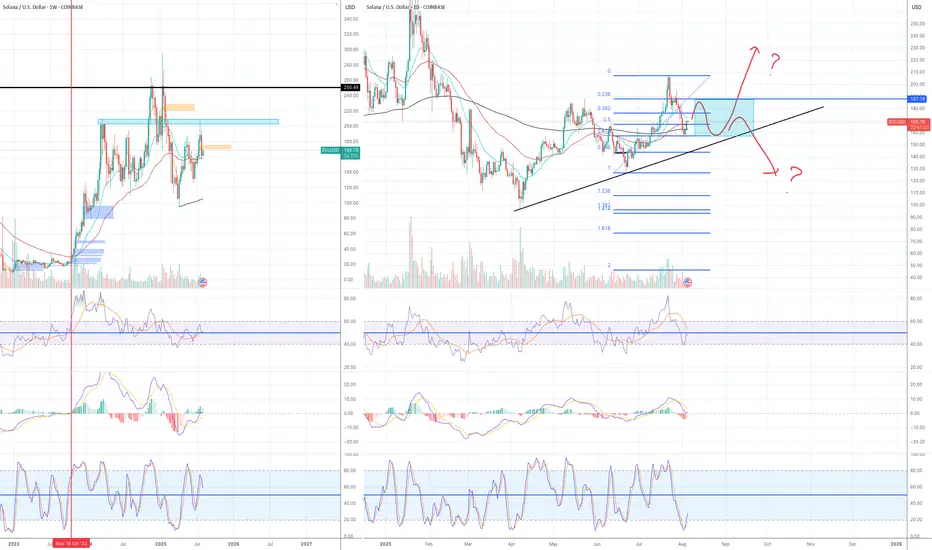
Weekly:
1) MACD line (faster line) has finally entered the bull zone since it dropped to $95 on April 25.
2) RSI line (orange one) has entered the bull zone.
3) EMA 5 > EMA21> EMA 55
Daily:
1) EMA 21> EMA55> EMA200
2) MACD lines are still in the bull zone.
3) Stochastic has reached the oversold territory and crossed to the upside.
4) The price is still forming higher high higher low above the ascending trendline.
5) The price has retraced to Fib 0.618 and now it is bouncing up.
6) The daily candle on 2n August closed at Fib 0.618 and yesterday's candle closed above both EMA55 and 200.
As I mentioned in my previous articles, when EMA55 crosses above EMA200, the price often retraces significantly before it starts to move to the upside. So I was prepared for the price to drop to Fib 0.382, 0.5, 0.618 or 0.786. At the moment, Fib 0.618 seems to be working as the lines of support.
The current price action looks good for the bull, however, $185-200 zone has been a very tough area to break. Therefore, I am prepared for a few scenarios:
Scenario 1: The price will move to Fib 0236 zone at $188 area. It fails to break above and drops to retest either the ascending trendline or wicks down to Fib 0.786/$143 area.
Scenario 2: The price will move to Fib 0.236 zone, consolidates in the area and moves up.
Scenario 3: It fails to move above Fib 0.236 level, drops below the ascending trendline and Fib 0.786. If it happens, I need to re assess my bullish bias.
It has been a difficult asset to trade, however, I can still see bullish momentum is building up in higher time frames:
Weekly:
1) MACD line (faster line) has finally entered the bull zone since it dropped to $95 on April 25.
2) RSI line (orange one) has entered the bull zone.
3) EMA 5 > EMA21> EMA 55
Daily:
1) EMA 21> EMA55> EMA200
2) MACD lines are still in the bull zone.
3) Stochastic has reached the oversold territory and crossed to the upside.
4) The price is still forming higher high higher low above the ascending trendline.
5) The price has retraced to Fib 0.618 and now it is bouncing up.
6) The daily candle on 2n August closed at Fib 0.618 and yesterday's candle closed above both EMA55 and 200.
As I mentioned in my previous articles, when EMA55 crosses above EMA200, the price often retraces significantly before it starts to move to the upside. So I was prepared for the price to drop to Fib 0.382, 0.5, 0.618 or 0.786. At the moment, Fib 0.618 seems to be working as the lines of support.
The current price action looks good for the bull, however, $185-200 zone has been a very tough area to break. Therefore, I am prepared for a few scenarios:
Scenario 1: The price will move to Fib 0236 zone at $188 area. It fails to break above and drops to retest either the ascending trendline or wicks down to Fib 0.786/$143 area.
Scenario 2: The price will move to Fib 0.236 zone, consolidates in the area and moves up.
Scenario 3: It fails to move above Fib 0.236 level, drops below the ascending trendline and Fib 0.786. If it happens, I need to re assess my bullish bias.
Related publications
Disclaimer
The information and publications are not meant to be, and do not constitute, financial, investment, trading, or other types of advice or recommendations supplied or endorsed by TradingView. Read more in the Terms of Use.
Related publications
Disclaimer
The information and publications are not meant to be, and do not constitute, financial, investment, trading, or other types of advice or recommendations supplied or endorsed by TradingView. Read more in the Terms of Use.