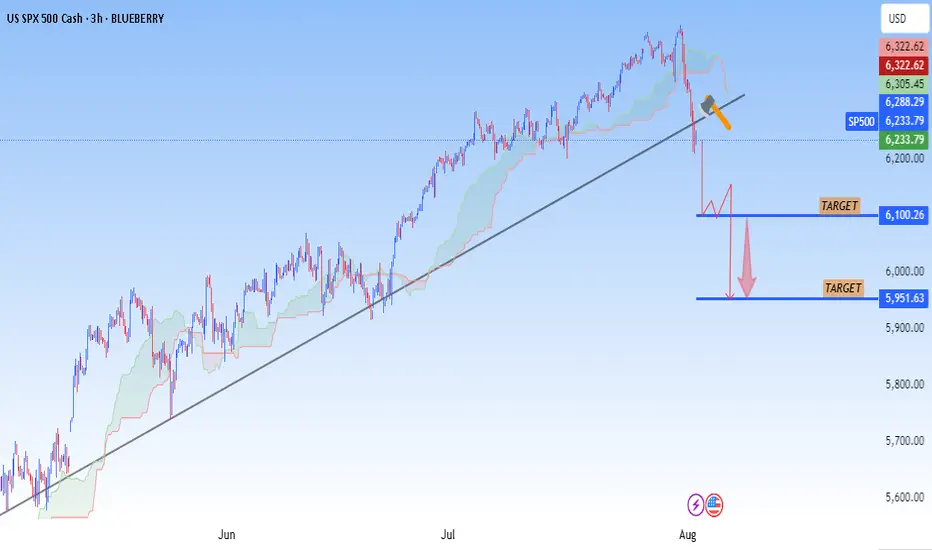
Chart Analysis (Sell Setup Identified):
A major ascending trendline has been broken.
A retest of the broken trendline is marked with an orange arrow.
This suggests a potential bearish reversal setup — perfect for a sell setup.
The chart already has two clear targets marked below.
---
🎯 Sell Entry Target:
You should consider entering a sell position near the retest zone:
Sell Entry Zone: Around 6,290 – 6,310 (Where price is retesting the trendline)
---
📉 Sell Setup Targets:
1. Target 1: 6,100.26
✅ Take partial profits here
🛡 You can also move stop loss to breakeven
2. Target 2: 5,951.43
🎯 Final target (strong support level)
---
⛔ Stop Loss (SL):
Place SL above the retest candle or just above trendline:
Around 6,330 – 6,345
---
Summary:
Type: Sell setup (bearish trendline break + retest)
Entry: 6,290 – 6,310
Stop Loss: 6,330 – 6,345
Targets:
• TP1: 6,100
• TP2: 5,951
✅JOIN FREE TELEGRAM
✅t.me/+atTT3a4htZ8yZjQ0
✅DAILY 3-4 SIGNALS
✅ALL PAIRS CRYPTO & GOLD
✅t.me/+atTT3a4htZ8yZjQ0
✅DAILY 3-4 SIGNALS
✅ALL PAIRS CRYPTO & GOLD
Disclaimer
The information and publications are not meant to be, and do not constitute, financial, investment, trading, or other types of advice or recommendations supplied or endorsed by TradingView. Read more in the Terms of Use.
