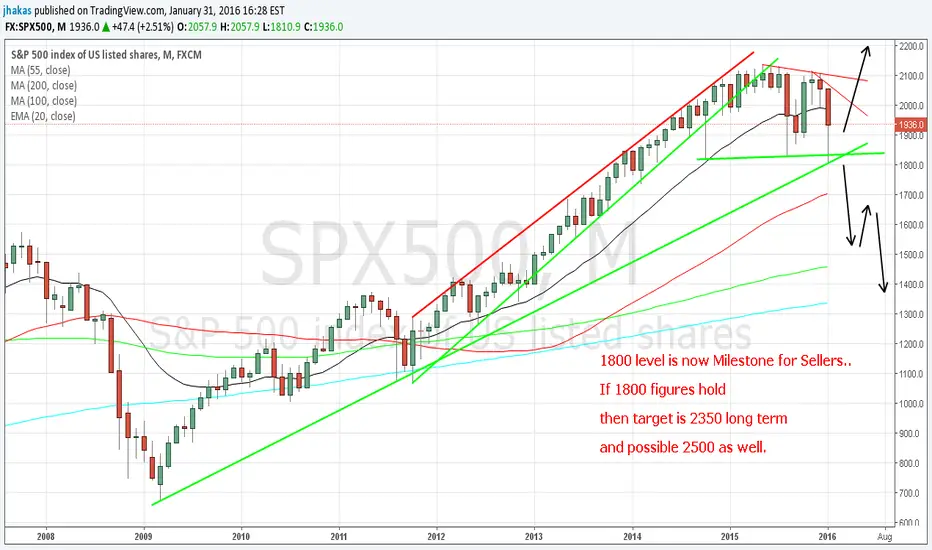
We have Long Term Trendline @ 1811 on Monthly Time Frame, and SPX500 jumped exactly from there.
If this level holds, then i expect new highs and towards 2350 and 2500. But, if anyhow 1800 level taken out then i expect SPX500 drop towards 15714 or 1531.
If this level holds, then i expect new highs and towards 2350 and 2500. But, if anyhow 1800 level taken out then i expect SPX500 drop towards 15714 or 1531.
Note
WeeklyNote
4hr Time FrameNote
1 hour Double BottomDisclaimer
The information and publications are not meant to be, and do not constitute, financial, investment, trading, or other types of advice or recommendations supplied or endorsed by TradingView. Read more in the Terms of Use.
Disclaimer
The information and publications are not meant to be, and do not constitute, financial, investment, trading, or other types of advice or recommendations supplied or endorsed by TradingView. Read more in the Terms of Use.