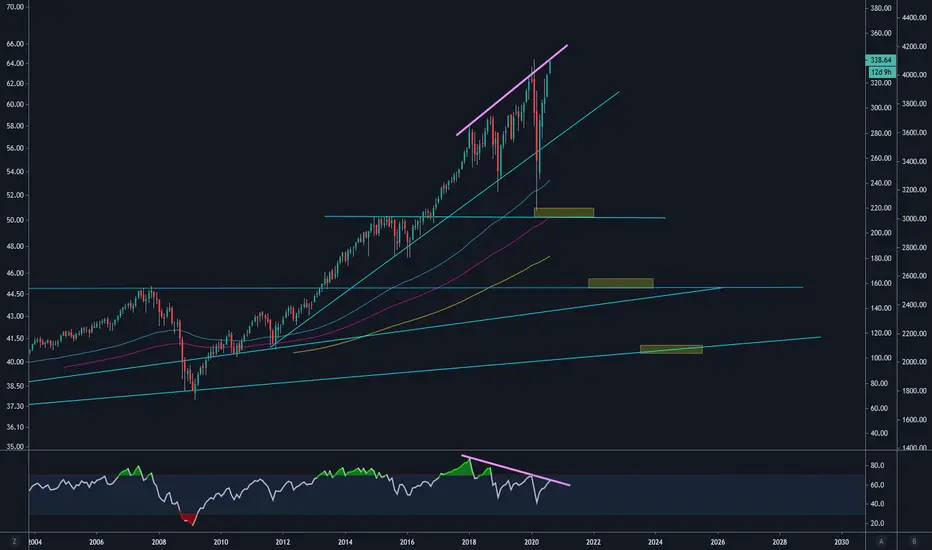
Update to my previous S&P chart from Nov '19, illustrating bearish divergence that led to a massive selloff in Feb - Mar of 2020, nailing my short target exactly:

Fast forward now to August 2020... The questions I have are:
1) Will we get continuation from the V shaped recovery and move beyond the 3389 level to continue making all time highs? (AKA - Printer go Brrrrrr by the FED)
2) Will the bearish divergence continue to plague the chart and cause another retracement in an attempt to double bottom at 2180? Keep in mind, RSI has not entered oversold on the Monthly chart since SEP '08
3) Will there be a massive selloff by virtue of a news event that could take the S&P down to retest much lower levels in the 1600's?
Only time will tell us. Trade safe!
Note: Not trading or investment advice. Entertainment only!
Note
Could this be a diamond top forming? Note
Thoughts Note
Note
Watching this count.. Note
S&P breakdown pattern afterhours. s3.amazonaws.com/tradingview/snapshots/s/snOiRU0b.png
s3.amazonaws.com/tradingview/snapshots/d/DnRSCzYI.png
Note
Note
Here's the completed structure I've been charting since Oct 16th. 3380 target nailed! Note
Watching this Tom DeMark Count here: Note
Diverging RSI retesting the trend. Watch for rejection or break up Note
Deep Crab? Disclaimer
The information and publications are not meant to be, and do not constitute, financial, investment, trading, or other types of advice or recommendations supplied or endorsed by TradingView. Read more in the Terms of Use.
Disclaimer
The information and publications are not meant to be, and do not constitute, financial, investment, trading, or other types of advice or recommendations supplied or endorsed by TradingView. Read more in the Terms of Use.