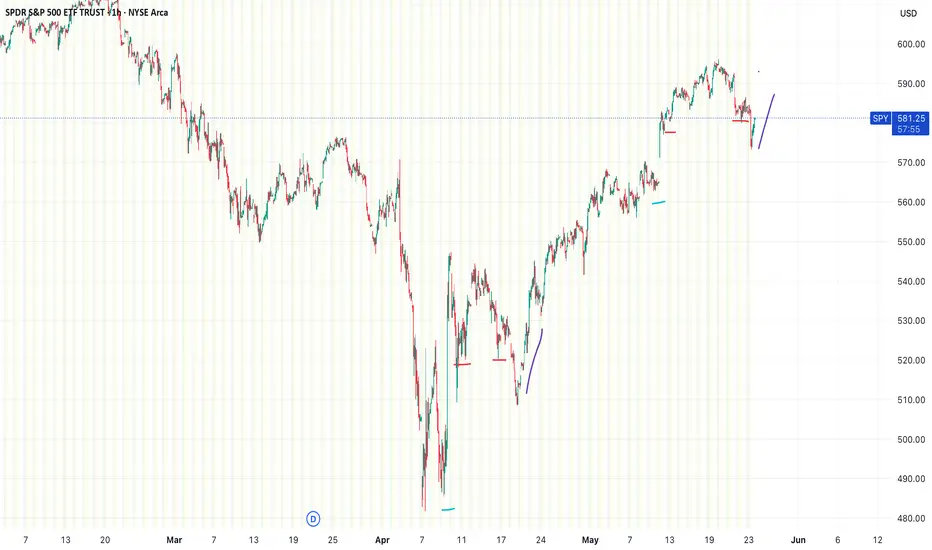
The chart shows the SPDR S&P 500 ETF Trust (SPY) on a 1-hour timeframe, with a pattern appearing to be repeating itself from late April/May(Liberation day announcements) dip and then boot and rally from trade announcements, all marked by colored lines.
The colored lines (blue, red, purple) highlight a recurring price action setup. Each set of lines seems to mark a sequence of movements:
Blue: Sharp drop, then gap up
Red: Consolidation at a lower higher from gap up, return to high, consolidation back lower at previous lower high
Purple: Breakout & reversal upward.
Disclaimer
The information and publications are not meant to be, and do not constitute, financial, investment, trading, or other types of advice or recommendations supplied or endorsed by TradingView. Read more in the Terms of Use.
Disclaimer
The information and publications are not meant to be, and do not constitute, financial, investment, trading, or other types of advice or recommendations supplied or endorsed by TradingView. Read more in the Terms of Use.