This is one of the cleanest HTF setups in the market right now — and it’s flying under the radar.
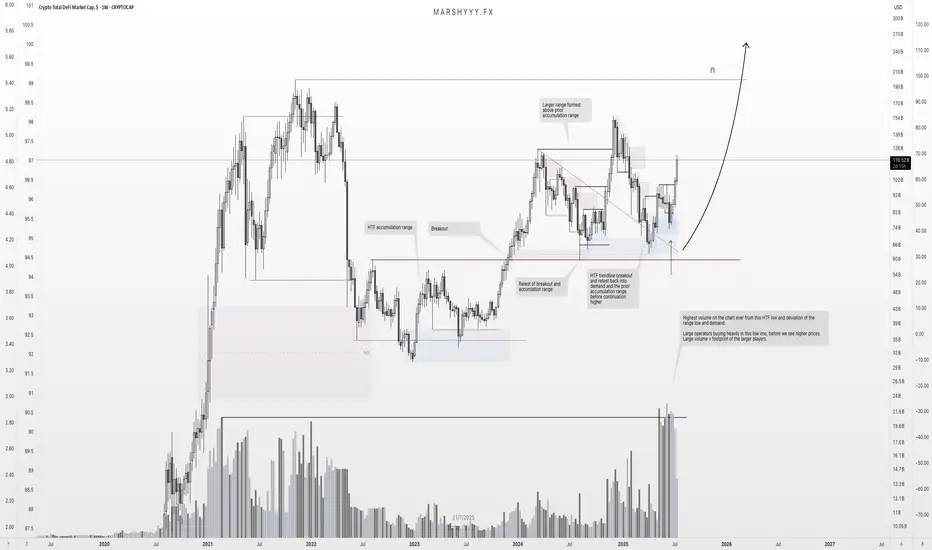
We're looking at TOTAL DEFI market cap, and it’s showing all the signs of strong reaccumulation following a textbook breakout–retest structure off a larger HTF accumulation base.
Price broke out from the 2023–2024 accumulation range, retested that breakout zone and range highs in August 2024, swept liquidity, and tapped into unmitigated demand within the accumulation range — before climbing back to the $155B region, creating a larger range above the prior accumulation range it broke out from.
Since then, price pulled all the way back to range lows and HTF demand at $65B, forming a new bullish reversal from this key region and retesting the trendline breakout before continuing another leg higher — as we’re now seeing unfold.
But here’s the key:
🧠 That recent deviation came with the highest volume ever recorded on this chart — right off the range low and HTF demand.
That’s not retail. That’s large operators loading up, leaving their footprint ahead of the next expansion leg.
We’ve now:
- Broken the descending trendline cleanly
- Flipped key SR levels back into support
- Started pushing higher with strong HTF closes
📈 Expectation:
This is a spring + test setup within a reaccumulation range. I’m targeting continuation toward the range highs, followed by a macro breakout that could take DeFi market cap to $200B+ — especially once the prior distribution zone is reclaimed.
This aligns with the broader cycle narrative — liquidity rotating back into altcoins, particularly DeFi, as stablecoin dominance declines and the market shifts fully risk-on into the final phase of the bull cycle.
Key Structure Summary:
- HTF accumulation base → breakout → retest → demand sweep
- Largest volume spike = operator footprint
- Higher lows forming = market structure flipping
- Expecting expansion to $200B+ as trend continues
One to watch closely.
Don’t fade the volume. Don’t fade the structure.
Disclaimer
The information and publications are not meant to be, and do not constitute, financial, investment, trading, or other types of advice or recommendations supplied or endorsed by TradingView. Read more in the Terms of Use.
Disclaimer
The information and publications are not meant to be, and do not constitute, financial, investment, trading, or other types of advice or recommendations supplied or endorsed by TradingView. Read more in the Terms of Use.