breakout to the upside, but it's currently approaching a key resistance zone, which could determine the next move. Here’s a breakdown:
🔍 What the Chart Shows:
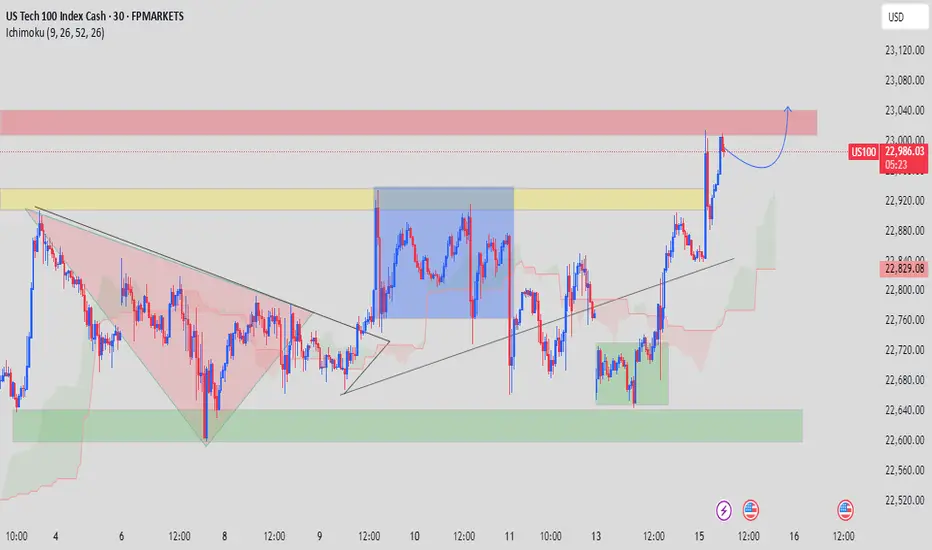
Triangle Breakout:
There was a symmetrical triangle (or wedge) pattern forming over several days, which has recently broken to the upside.
This typically suggests bullish momentum.
Support & Resistance Zones:
Resistance Zone: Around 22,990–23,040 (highlighted in yellow at the top).
Price is currently testing or rejecting this zone.
Support Zone: Around 22,640–22,700, and an intermediate one around 22,860 (former resistance turned support).
Ichimoku Cloud:
Price is well above the cloud, suggesting bullish momentum.
The cloud is also rising, which supports continued upside — if price can break and hold above the resistance.
Volume (not shown):
It would be helpful to check volume on this breakout. Strong volume would support a continued move up.
✅ Bullish (Buy) Bias IF:
Price breaks and holds above 23,040 with strong momentum.
Retest of the breakout zone (around 22,920–22,960) holds as support.
Cloud continues to rise and price stays above it.
❌ Bearish (Sell) Bias IF:
Price fails to break above the resistance zone and starts forming a double top.
You see bearish candles (e.g., pin bar, engulfing) in the resistance area.
Breakdown below 22,920 (back inside old range) signals a fake breakout.
🔄 Conclusion (as of now):
Short-term: Neutral-to-bullish as price is at resistance.
Wait for confirmation:
A breakout above 23,040 = Buy.
A rejection with bearish structure = Potential Sell.
🔍 What the Chart Shows:
Triangle Breakout:
There was a symmetrical triangle (or wedge) pattern forming over several days, which has recently broken to the upside.
This typically suggests bullish momentum.
Support & Resistance Zones:
Resistance Zone: Around 22,990–23,040 (highlighted in yellow at the top).
Price is currently testing or rejecting this zone.
Support Zone: Around 22,640–22,700, and an intermediate one around 22,860 (former resistance turned support).
Ichimoku Cloud:
Price is well above the cloud, suggesting bullish momentum.
The cloud is also rising, which supports continued upside — if price can break and hold above the resistance.
Volume (not shown):
It would be helpful to check volume on this breakout. Strong volume would support a continued move up.
✅ Bullish (Buy) Bias IF:
Price breaks and holds above 23,040 with strong momentum.
Retest of the breakout zone (around 22,920–22,960) holds as support.
Cloud continues to rise and price stays above it.
❌ Bearish (Sell) Bias IF:
Price fails to break above the resistance zone and starts forming a double top.
You see bearish candles (e.g., pin bar, engulfing) in the resistance area.
Breakdown below 22,920 (back inside old range) signals a fake breakout.
🔄 Conclusion (as of now):
Short-term: Neutral-to-bullish as price is at resistance.
Wait for confirmation:
A breakout above 23,040 = Buy.
A rejection with bearish structure = Potential Sell.
Trade active
Trade closed: target reached
✅JOIN FREE TELEGRAM
✅t.me/+atTT3a4htZ8yZjQ0
✅DAILY 3-4 SIGNALS
✅ALL PAIRS CRYPTO & GOLD
✅t.me/+atTT3a4htZ8yZjQ0
✅DAILY 3-4 SIGNALS
✅ALL PAIRS CRYPTO & GOLD
Disclaimer
The information and publications are not meant to be, and do not constitute, financial, investment, trading, or other types of advice or recommendations supplied or endorsed by TradingView. Read more in the Terms of Use.