Technical & Chart Pattern Analysis:
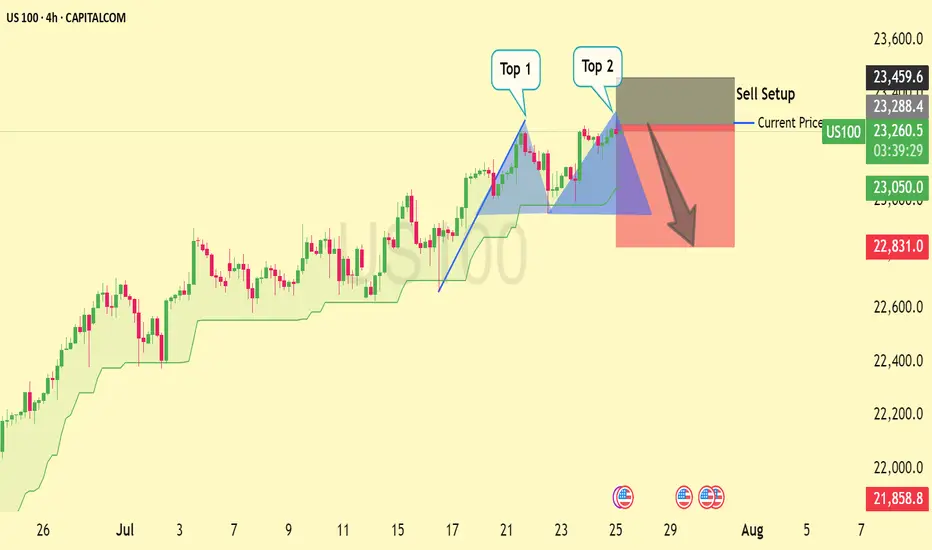
Bearish Double Top Pattern: The chart shows a clear Double Top formation at the recent high, indicating potential trend exhaustion and a bearish reversal setup.
Sell Setup Identified: Price is testing the neckline near 23,260, and a break below could trigger a move toward the 22,831 support zone.
Trend Structure: Bullish momentum is weakening after a sharp rally; consolidation with lower highs signals bearish intent.
Bearish Confirmation Pending: A decisive breakdown below the blue neckline area may confirm the pattern and activate the short setup.
📉 Fundamental Drivers:
Earnings Season Impact: Tech-heavy NASDAQ may face volatility due to mixed earnings reports and forward guidance concerns.
Federal Reserve Outlook: Continued uncertainty around Fed rate cuts is keeping risk sentiment fragile, which could pressure growth stocks.
Economic Data: Upcoming U.S. inflation or labor market data will be key in determining sentiment for tech and growth equities.
🎯 Sell Entry: ~23,260
🧱 Resistance Zone: 23,404
📉 Target Zone: 22,831 and potentially lower toward 21,858
🚫 Stop Loss: Above 23,404
✅ If this setup resonates with your trading strategy, support with a like and follow to stay updated on more chart patterns and analysis!
Disclaimer
The information and publications are not meant to be, and do not constitute, financial, investment, trading, or other types of advice or recommendations supplied or endorsed by TradingView. Read more in the Terms of Use.
Disclaimer
The information and publications are not meant to be, and do not constitute, financial, investment, trading, or other types of advice or recommendations supplied or endorsed by TradingView. Read more in the Terms of Use.